How to Trade Forex Signals: Step by Step With ForexR Signals

How Do You Trade a Forex Signal?
You read the signal’s entry, stop loss and three targets, check why it was published, size the trade so a loss costs a fixed share of your account, and place the order before the entry price is reached. Then you manage it the way the signal’s own record does. This guide walks through each step on real ForexR signals, using a demo account.
What you need: a demo account on MT5, cTrader or another platform, and the ForexR Signals board open in a second tab. Every signal there is a practice trade tracked against live prices with no real money behind it. Signals are information, not advice, and a demo account is the right place to learn how they behave.
The examples come from 6 November 2026, the day the signals went public: a Bitcoin sell stop from the AI desk and a USD/CAD sell from the RSI(2) pullback rule. Whatever happened to them next is on their own pages, wins and losses alike.
Step 1: Find a Signal on the Board
The board has three tabs. Waiting for entry lists signals whose entry price has not been reached yet, and these are the only ones you can still place at the published levels. Live lists trades that have filled and are running. Closed keeps every finished trade with its result.
Type of trading sorts the board into scalping, intraday, swing and news signals, and three filters narrow it further. Instrument covers ten markets, from EUR/USD to gold, Bitcoin, WTI crude and the Nasdaq 100. Strategy picks one rule. Source separates the data rules, which are strategies written in code that read the price chart, from AI proposals, made by a model that reads the same facts the analysis desk uses.
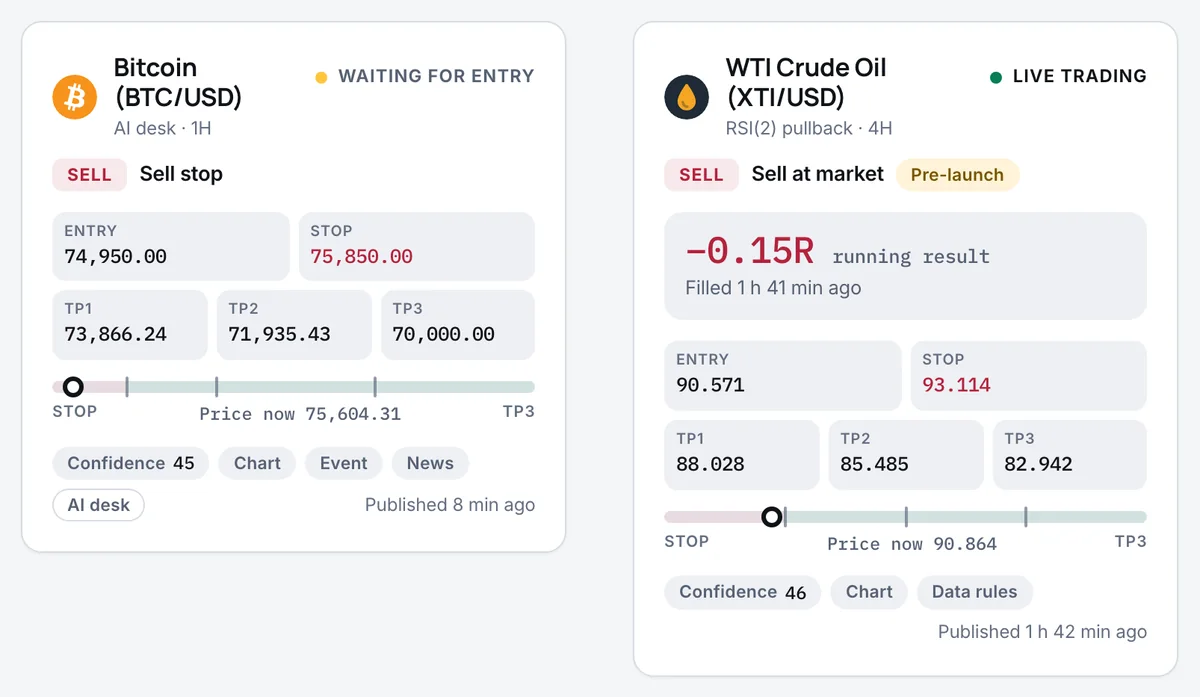
Each card shows the instrument, the status, the side, the order type, the entry, the stop and three targets, with a bar that places the current price between the stop and the last target. Chips under it give the confidence score and what the trade rests on. A card marked Pre-launch was published while the signals were tracked privately before launch, and it counts on the record like any other.
To hear about new signals without watching the page, switch on ForexR alerts with the bell icon and follow an instrument. New signals and closes from a few selected strategies then arrive as browser notifications, a few a day at most.
Step 2: Read the Levels and the Order Type
Open a card to see the full signal. The Levels panel lists everything that was fixed when it was published:
- Entry and entry zone: the price the trade starts at, with a narrow zone around it. If the price is inside the zone when you enter, your risk is close to the published one.
- Order type: a limit order waits for a better price (a buy limit below the market, a sell limit above it). A stop order waits for the price to break through a level (a buy stop above, a sell stop below). “At market” means the rule entered straight away.
- Stop loss: the price at which the idea is wrong. The distance from entry to stop is one unit of risk, written 1R.
- TP1, TP2 and TP3: the three take-profit targets. The data rules place them at 1R, 2R and 3R; AI proposals use chart levels, so their multiples vary.
- Expiry: a waiting signal that has not filled by this time expires and is never traded.
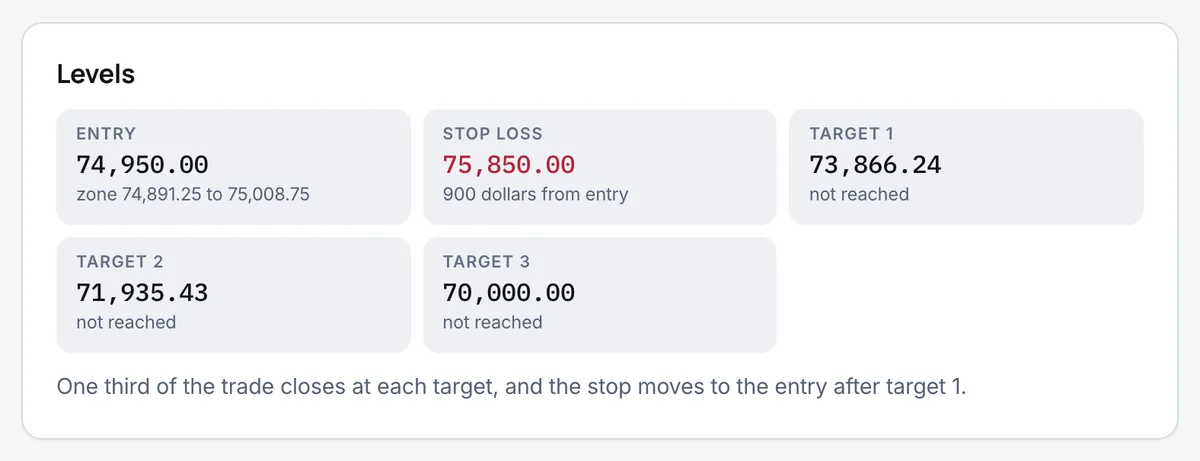
Take the Bitcoin example: a sell stop at 74,950 with the stop loss at 75,850. That is 900 dollars of risk per coin, so 1R = 900 dollars. TP1 at 73,866.24 is about 1.2R away and TP3 at 70,000 is 5.5R away. The order waited about 600 dollars under the price for a break of the day’s low, and it was set to expire six hours after it was published.
Step 3: Check Why It Was Taken
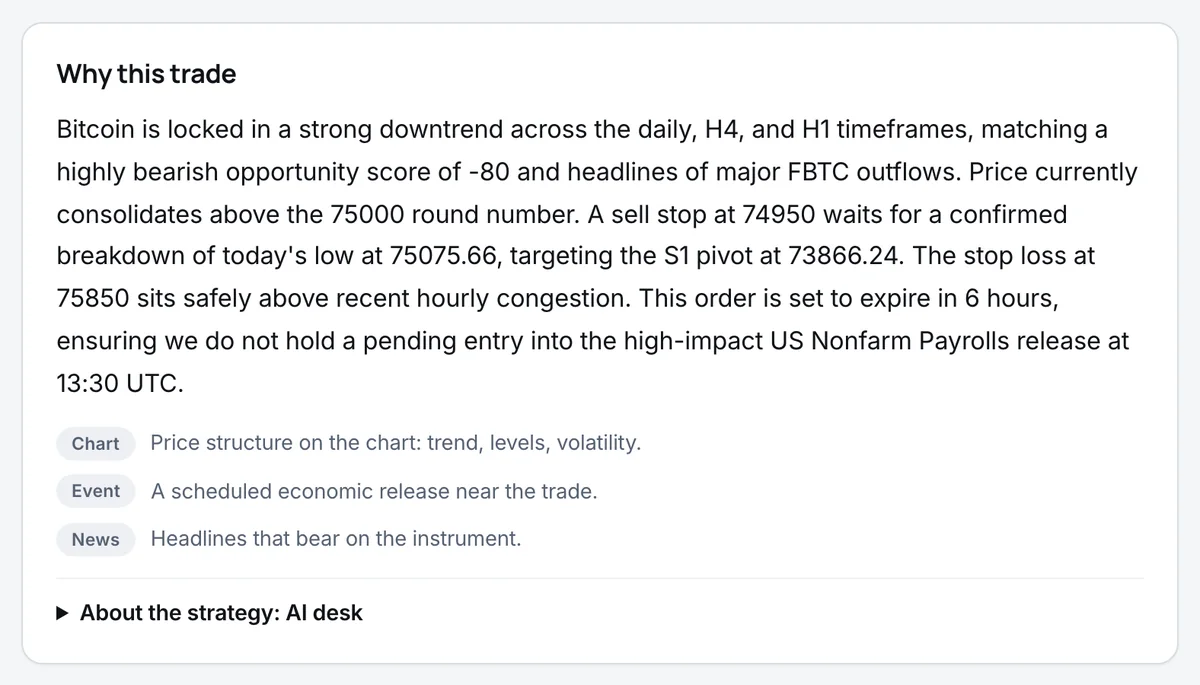
Every signal carries a short reason written from the facts at the moment it was published: the trend on several timeframes, the nearest levels, volatility, upcoming economic releases and the headlines. Chips show the basis: Chart for price structure, Event for a scheduled release near the trade and News for headlines. The Bitcoin reason named the downtrend, the level the order waited under and an expiry set to end before the US jobs report.
Then open About the strategy under the reason. Two gold rules, a 4-hour trend breakout and the London breakout, were chosen because they made money after costs in every year of a 2023 to 2026 backtest. Most of the others are popular strategies, such as the EMA crossover and the RSI(2) pullback from the Pine Script strategies library. None of them made money after costs in every period tested, and their cards say so; they run so that anyone can watch how they do with live prices. AI proposals have no backtest at all, because a model’s decisions cannot be replayed on old prices.
Last, read the confidence score. It is a number from 0 to 100 given by an AI model, and once 20 signals in the same band have closed, the panel shows how they really ended. Until then, treat the score as an opinion and the measured rate as the evidence.
Step 4: Decide Whether to Take It
A signal is a trade idea with fixed levels. Whether it suits you is your call, and skipping one is always allowed. Run through these checks before you place anything:
- Is it still waiting? If the card says Live, the entry has already happened. Chasing a market that has moved changes the risk and the reward.
- Is news due before it expires? Look at the economic calendar for the instrument’s currencies. Some strategies stand aside before high-impact releases and others are built to trade them, so check which kind you are looking at. Either way, a trade can still be open when the numbers land.
- Do two signals disagree? Different strategies can point opposite ways on the same market. On launch day one rule was short USD/CAD while another had a buy limit waiting. Pick one or neither: taking both cancels out and pays the spread twice.
- Does the record back it? Press See its signals on the strategy card and read the closed trades. A handful of results proves little either way.
- Can you afford the stop? If even the smallest lot risks more than you planned, pass.
Step 5: Size the Trade From the Stop
Size every trade so that hitting the stop loses the same small share of your account, usually 0.5% to 1%. The Position size panel on the signal page does the sum: enter your balance, the risk per trade and your account currency, check the contract size, and it returns the lot size rounded down to 0.01.
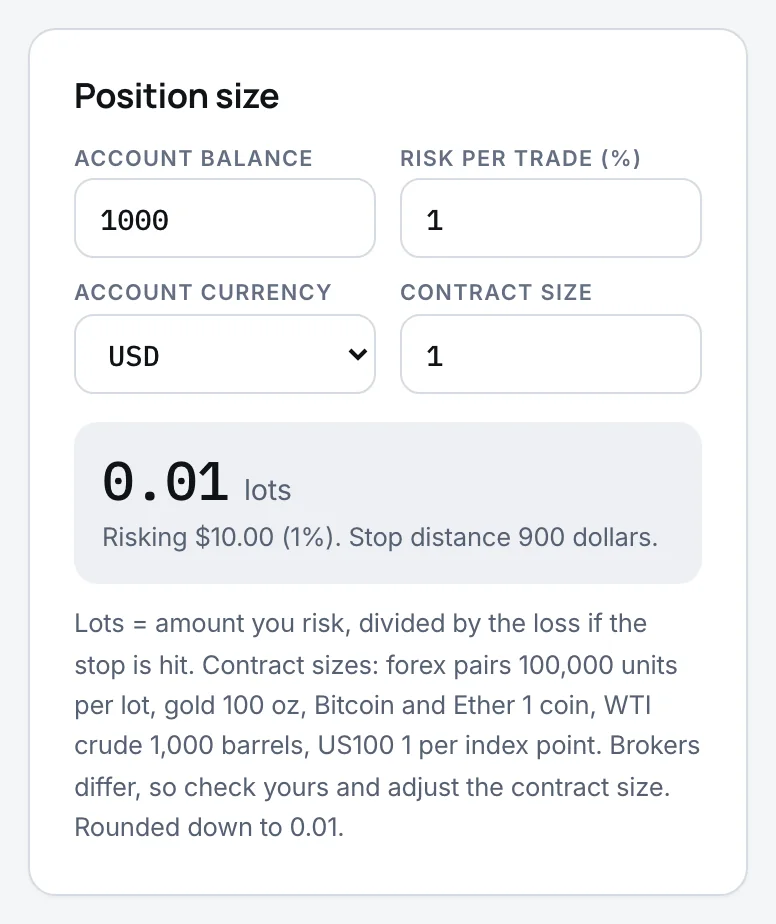
For the Bitcoin signal, a $1,000 account risking 1% has $10 to lose. The stop is 900 dollars away and one lot is one coin, so $10 ÷ $900 = 0.011 lots, rounded down to 0.01. Gold works the same way with 100 ounces per lot and a forex pair with 100,000 units. Brokers differ, so check the contract size in your platform’s symbol specification. The position sizing guide has the full formula and worked examples for small accounts.
Step 6: Place the Order Before the Entry
The Copy the prices panel gives each level its own copy button, plus Copy all. Below it, Open in your platform hands the signal to your software: cTrader opens its order screen already filled in, the MetaTrader buttons copy the levels and open the app on a phone, and TradingView gets a short Pine Script that draws the levels on your own chart.
Place the same order type the signal uses, at its entry, with its stop, and let the order expire when the signal does. Most platforms allow one take profit per position, so the usual way to follow all three targets is three equal orders, one per target. How to copy a trade signal shows each platform step by step, including how to split the lot size.
Step 7: Manage It Like the Record Does
The published result follows fixed management rules, and your result will only resemble it if you use the same ones:
- One third of the position closes at each target.
- After TP1, the stop on the remaining two thirds moves to the entry price.
- A trade still open at its maximum holding time closes at the market. Data rules can also close the last part on their own exit, such as two moving averages crossing back.
- A waiting signal that reaches TP1 or its stop before filling is cancelled, so delete your order. Delete it as well when a signal expires.
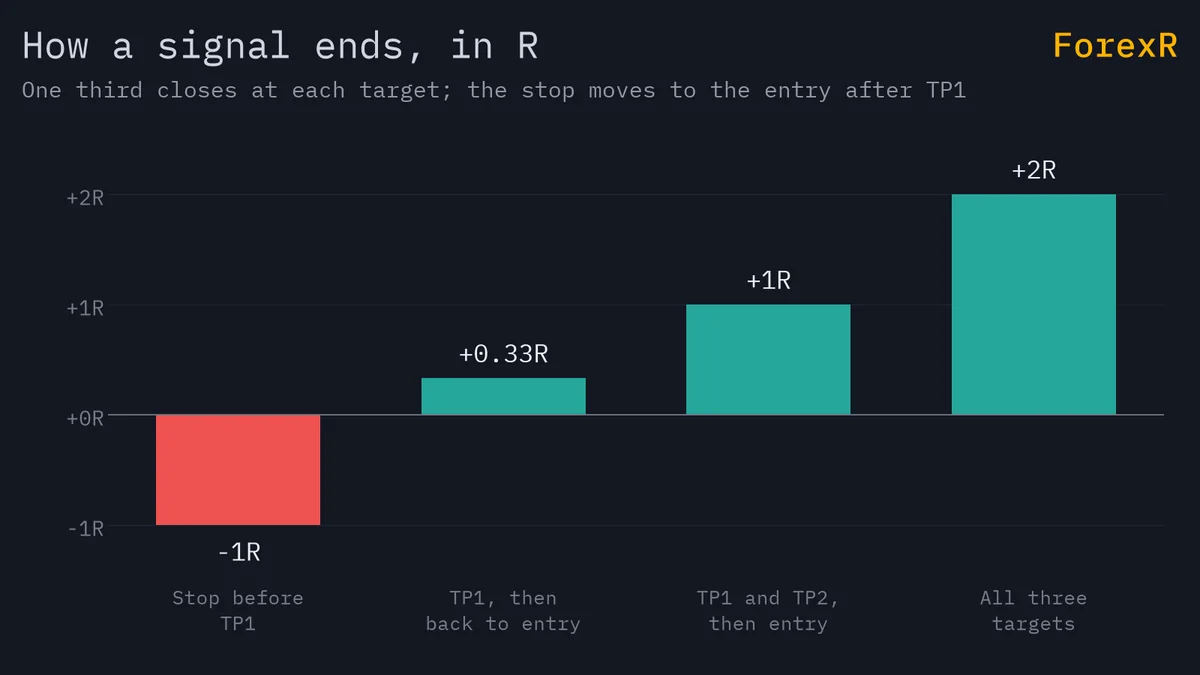
That gives four common endings. A loss before TP1 costs 1R. TP1 followed by a return to the entry nets +0.33R, because the first third made 1R and the rest closed flat. TP1 and TP2 make +1R, and all three targets +2R. The second case shows why a win rate alone misleads: that trade counts as a win, but a small one. Take-profit strategies explains what scaling out gives and costs.
Check the signal page at least once a day while a trade is open. Its timeline lists every fill, target, stop move and close with the time and price, so you can see straight away when your copy needs to change.
If Something Goes Wrong
- Your broker’s price differs from the signal’s. Signals are tracked on one data feed, and brokers quote slightly different prices, most of all on indices and oil. If the gap is steady, shift all five levels by it so the distances stay as published.
- The signal shows Live but your order did not fill. Sells fill at the bid and buys at the ask, and spreads differ between feeds. If the price has moved away, leave it rather than entering late at a worse price.
- Your stop was hit but the signal is still open. A wider spread on your account can trigger a stop that the tracking feed did not. That is a cost of trading, not a reason to set stops further away next time.
- You missed the entry. Let it go. Another signal will follow, and the record only describes trades taken at the published levels.
- A signal lost. Read the AI review on its page, which sets what happened against the reason the trade was taken. Every record has losses; a run of them is a reason to cut your size, never to double it.
What You Just Learned
- Waiting signals can still be placed; live ones have already started.
- Entry, stop, three targets and an expiry are fixed at publication, and the stop distance is 1R.
- Read the reason, the strategy card and its record before you trust a signal.
- Size from the stop so that a loss costs 0.5% to 1% of the account.
- Close a third at each target and move the stop to the entry after TP1, as the record does.
- Delete your order when a signal expires or is cancelled, and never chase one that has moved.
Before you judge any strategy by its results, read how to read a signal track record. And if you still need an account with MT5, cTrader or TradingView, compare brokers by platform and cost, then practise on demo first.
FAQ
Are ForexR Signals free?
Yes. Every signal, its levels, its reason and the full track record are free to read, with no sign-up. They are practice trades tracked against live prices, with no real money behind them, and they are information rather than advice. You place and manage any trade yourself, on your own account and at your own risk.
Should I copy every signal?
No. The board includes popular strategies whose backtests lost money after costs; they run so their live record can be seen. Taking every signal would also put opposite trades on the same market and more open risk than most accounts should carry. Choose a few strategies whose records you have read, and size each trade from its stop.
What does 1R mean on a signal?
R is the distance from the entry to the stop loss, one unit of risk. A trade that hits its stop loses 1R. With targets at 1R, 2R and 3R and a third closed at each, a trade that reaches all three makes 2R. Results in R compare fairly across instruments and account sizes, which pips and dollars do not.
What if I miss the entry on a signal?
Skip it. Once a signal is live the published entry has passed, and entering later at a worse price raises your risk and shrinks your reward. If the price comes back into the entry zone soon after, you can still enter at the original levels, but most traders simply wait for the next signal.
See these strategies traded live
ForexR Signals publishes each trade before the entry, with its stop and three targets, and tracks it against live prices. Every win and loss stays on the record. Practice trades with no real money, not advice.