How to Read a Signal Track Record: Win Rate, R and Sample Size

How Do You Read a Signal Track Record?
Start with the average result per trade in R, not the win rate. Then check how many closed trades it rests on, how many signals never filled, whether one strategy or instrument carries the total, and whether old signals could have been edited. A record is convincing only when all five hold up, and a young record cannot pass yet.

This guide uses the summary at the top of ForexR Signals as its example: closed trades, win rate, total result, average per trade, fill rate and what is open now. The same questions work on any provider’s results page. For the basics of taking a single signal, see how to trade forex signals; for the warning signs of paid signal groups, see forex signals.
Why Results Are Counted in R
R is one unit of risk: the distance from a signal’s entry to its stop. A trade that hits its stop is −1R, and a trade that makes twice its risk is +2R. Counting in R puts a 20-pip EUR/USD trade and a 900-dollar Bitcoin trade on the same scale. It also converts straight into money: at 1% risk per trade, +10R is roughly +10% on the account before compounding.
Pips mislead because a pip means different things on different instruments, and a provider can inflate a total by trading wide-stop markets. Percentages mislead because they depend on the lot sizes the provider happened to use. The two figures that matter are the total result and the average per trade, also called expectancy. An average of +0.10R means that, over many trades, each one added a tenth of its risk.
Win Rate Means Nothing Without the Average Win
ForexR counts a win as any trade that ends above 0R. Under the signals’ management, that includes a trade that reached TP1 and then came back to the entry for +0.33R. A win rate can therefore look high while the strategy loses money, and the reverse:
- Strategy A wins 60% of its trades, mostly at +0.33R, and loses 1R on the rest: 0.6 × 0.33 − 0.4 × 1 = −0.20R per trade.
- Strategy B wins 35% of its trades at +2R on average: 0.35 × 2 − 0.65 × 1 = +0.05R per trade.
B is the better strategy with the worse-looking win rate. Always read the win rate next to the average per trade. The risk-reward ratio guide gives the break-even win rate for each size of target.
Fill Rate, Expired and Cancelled Signals
Not every signal becomes a trade. A waiting signal expires if the price never reaches its entry before the deadline. It is cancelled if the price reaches TP1 or the stop first, because counting a fill after the move had already happened would flatter the record. Neither counts in the win rate, and both stay visible on the board.
The fill rate is the share of signals whose entry was reached. A low fill rate is not bad in itself, but it changes what the results mean for you. If a strategy fills one signal in three, you place three orders for every trade, and the setups it skipped are part of its character. Be wary of any service that shows only the signals that filled.
How Many Trades Before the Record Means Something?
Very few signal records are long enough to judge. Single results are noisy, so the average per trade carries a margin of error that shrinks only with the square root of the number of trades. With a spread of results like that of the three-target management, the range that probably holds the true average is about ±0.5R after 20 trades, ±0.2R after 100 and ±0.13R after 300.
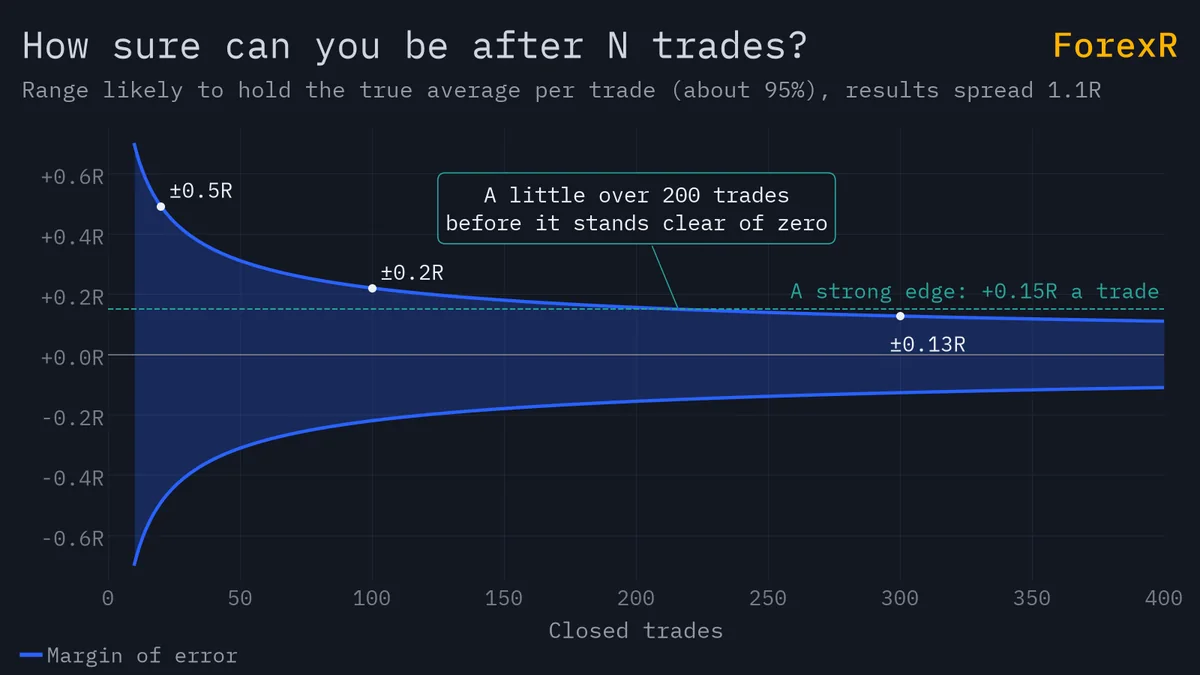
So a rule that really earns +0.15R a trade, a strong edge for a simple strategy, cannot be told apart from zero until a little over 200 trades have closed. At 47 trades a year, the backtest pace of the gold trend rule, that takes more than four years. Early results, good or bad, say little, which is why the board prints a small-sample note under the summary. The backtesting and trading journal guide covers expectancy and sample size in more depth.
Backtest vs Live: Read Both, Trust the Live
Each strategy card shows its backtest year by year, its trades per year, its profit factor (gross profit divided by gross loss) and a caveat in plain words. Under that sits the live record so far. The backtest says what the rule did on old prices with costs included; the live record says what it is doing now, with no chance to tune it afterwards.
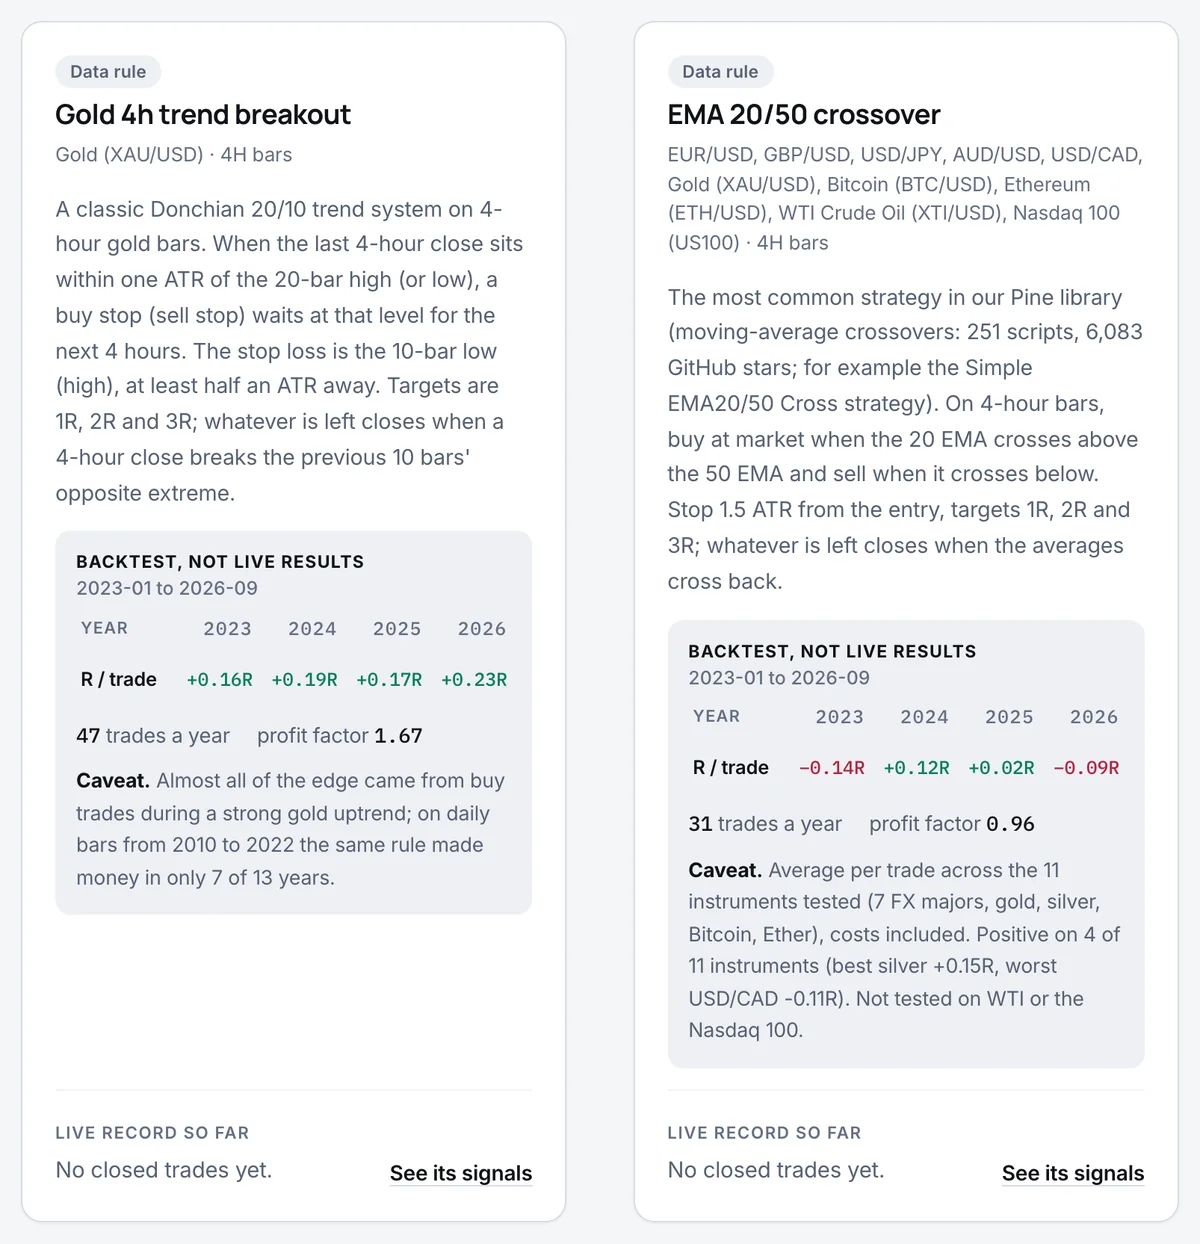
The two cards above show the difference. The gold trend breakout made between +0.16R and +0.23R a trade in every year from 2023 to 2026, with a profit factor of 1.67, and its caveat warns that most of that edge came from buys during a strong gold uptrend. The EMA 20/50 crossover, the most common strategy in the Pine Script strategies library, lost money in two of the four years and has a profit factor below 1. Both run live so their records can be compared as they grow. A backtest that holds every year is a reason to watch a strategy, not proof that it will keep working.
Split the Record by Strategy, Instrument and Source
A good total can hide one strategy that carries all the others. The track record section breaks the results down by strategy, by instrument and by source, data rules against AI proposals, with closed trades, win rate and total R for each. A cumulative curve adds up every closed trade in order.
Read that curve for its worst stretch, the drawdown, measured in R from a peak to the following low. A strategy that averages +0.1R a trade can still fall 10R before it recovers, and at 1% risk per trade that is roughly a 10% drop in the account. If you could not sit through the deepest dip on the curve, the strategy is too risky at your size.
Does the Confidence Score Mean Anything?
Every signal gets a confidence score from 0 to 100, given by an AI model with a one-line justification. A score is only useful if higher scores really end better, so closed signals are grouped into bands of ten points. Once a band holds 20 closed trades, the panel shows how often they won and their average R.
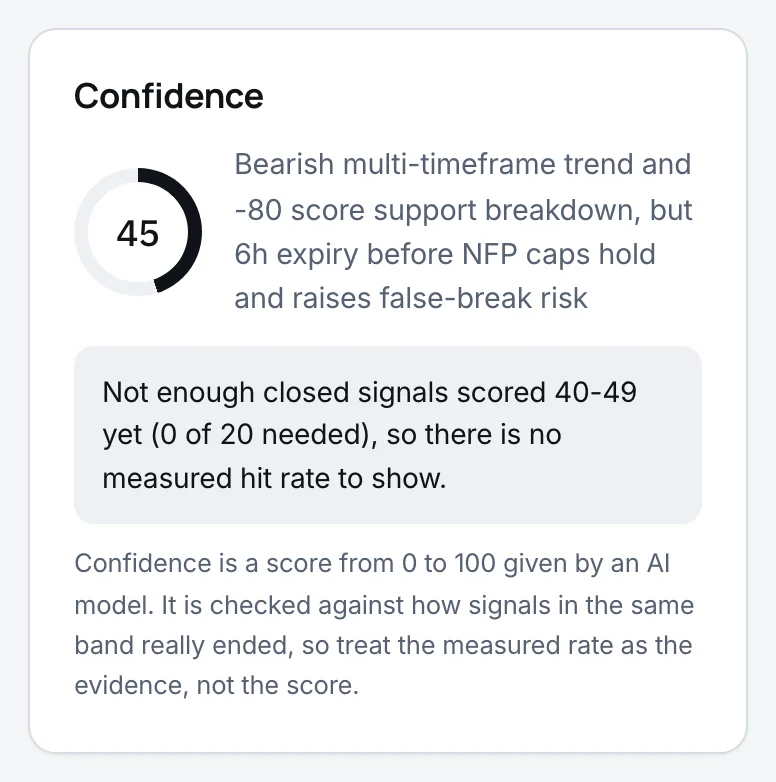
If the signals scored in the 70s win no more often than those in the 40s, the score adds nothing and you can ignore it. Before a band reaches 20 trades the panel says so rather than showing a number. The AI trading signals guide explains why an AI label is not an edge on its own.
Proof the Record Was Not Edited
A record is only worth reading if nothing in it can be removed or changed later. When a ForexR signal is published, its fixed fields, from the instrument and side to the entry, stop, targets and expiry, are fingerprinted with SHA-256, and each fingerprint includes the one before it. Changing or deleting any old signal would break every fingerprint that follows.
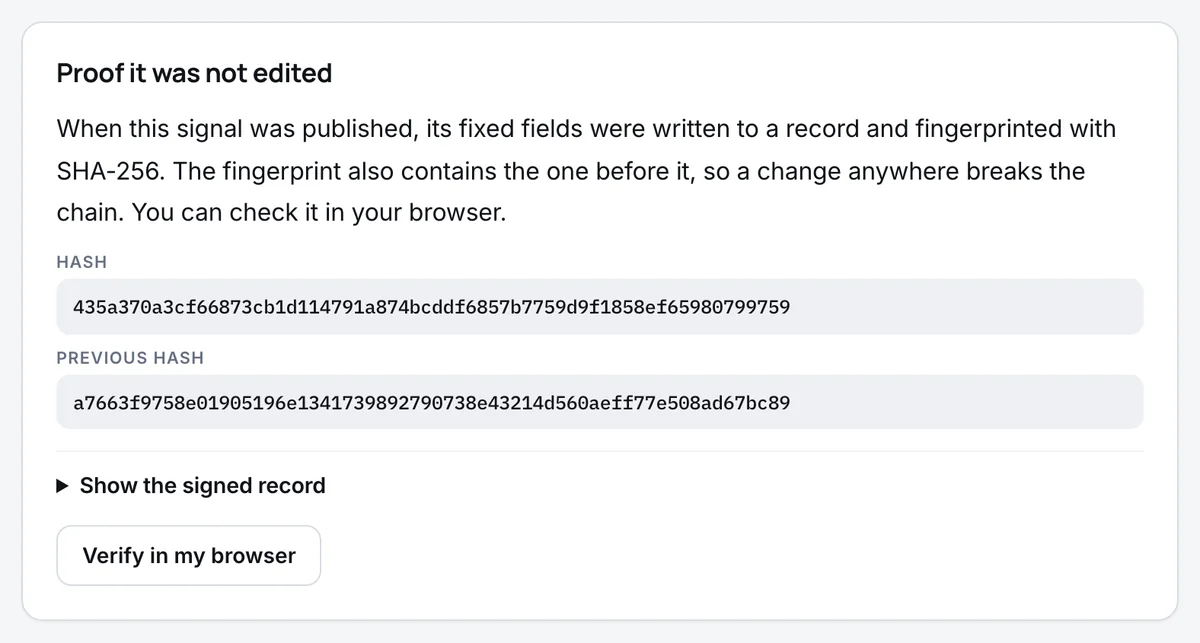
Verify in my browser, on any signal page, recomputes the fingerprint from the signed record on your own device. Losing trades stay on the board too, each with an AI review that sets what happened against the reason the trade was taken.
The Same Checks for Any Signal Provider
- Results in R, or with the stop shown on every trade, rather than in pips or screenshots.
- The average per trade printed next to the win rate.
- Every signal published before its entry, with expired, cancelled and losing ones kept.
- At least 100 closed trades before you draw conclusions, and the worst drawdown on show.
- Results split by strategy and by instrument.
- Some way to prove that old signals were not edited or deleted.
A provider that cannot meet these is asking for trust it has not earned. The forex scams guide covers the signal sellers and fake account managers that this checklist is meant to catch.
FAQ
What is a good win rate for trading signals?
There is no good win rate on its own. With targets at one to three times the risk, a strategy can make money while winning 35% of its trades and lose money while winning 60%, depending on the size of the average win. Judge the average result per trade in R, and use the win rate only to understand how a strategy feels to follow.
How many trades does a signal track record need?
At least 100 closed trades before the average per trade means much, and 200 to 300 to tell a small real edge from luck. Twenty or thirty trades can look brilliant or terrible by chance alone. Check as well that the record covers different conditions, such as trending months and quiet ones.
What does profit factor mean on a strategy card?
Profit factor is gross profit divided by gross loss over the same trades. Above 1 the strategy made money, and 1.5 or more after costs is strong for a simple rule; below 1 it lost. It ignores how many trades there were and how deep the drawdowns went, so read it next to the sample size and the equity curve.
Can a signal track record be faked?
Easily, if the provider controls it. Losing calls can be deleted, entries changed after the fact, or results shown only from a lucky period. Trust records that publish every signal before its entry, keep expired and losing ones, and offer proof that nothing was changed, such as a hash chain or an independently verified account.
See these strategies traded live
ForexR Signals publishes each trade before the entry, with its stop and three targets, and tracks it against live prices. Every win and loss stays on the record. Practice trades with no real money, not advice.