How to Read a Gold Price Forecast (and Why They Miss)

How Do You Read a Gold Price Forecast?
Treat a gold price forecast like a wedding budget: a plan built on assumptions, not a promise. Ask what horizon it covers, what it assumes about US interest rates and the dollar, whether each number is a target or a trigger, and what would prove it wrong. Then use it as a map of where something might happen, never as an order.
A forecast is a statement about the future price of gold, with a time attached. Nobody who writes one knows the future; the useful ones show their working, which is what you are reading.
What Kinds of Gold Forecast Will You Meet?
Four kinds turn up in searches and feeds, built in different ways.
- Bank year-end targets: a research desk publishes an average or year-end price, usually built from a view on US real yields, the dollar and central bank buying, and revises it several times a year.
- Chart-based levels: an analyst reads support, resistance, pivots and Fibonacci levels and says where gold may stall or break. These are conditional: if it holds here, then there.
- Model-based forecasts: a formula or an automated engine turns live data into levels and scenarios. ForexR's daily XAU/USD forecast is this kind, and the AI market analysis guide explains the family.
- Social media calls: a number with a date and no working, often posted after the move has started. Treat these as entertainment.
Only the first three can be checked against their assumptions; the fourth has none.
Five Questions to Ask Before You Trust a Gold Forecast
Back to the wedding budget. If it assumes 150 guests and a fixed venue price, the total is only as good as those two guesses, and changing the guest count moves every line. A gold forecast rests on two or three load-bearing guesses of its own, so ask:
- What is the horizon? A year-end target says nothing about next Tuesday, and a daily level says nothing about December.
- What does it assume about rates and the dollar? Most gold forecasts rest on a path for US real yields and the dollar. The interest rates guide explains why those two carry so much weight.
- Is each number a target or a trigger? A target is where the writer thinks price is going. A trigger is a level that, once crossed, makes the scenario live. Confusing them is the costliest reading error, so it has its own section below.
- What would prove it wrong? A serious forecast names an invalidation level or a condition. If nothing could prove it wrong, it is an opinion, not a forecast.
- Who benefits if you act on it? A dealer wants you to buy, a signal seller wants you to subscribe, a bank desk wants to be quoted. That does not make them wrong, but it tells you what to check.
Why Gold Forecasts Miss: 2013 and 2020
People get one thing wrong about bank forecasts: that experts with the best data land close to the mark most years. The record says otherwise. Going into 2013, many bank forecasts called for higher gold prices. On 12-15 April 2013 gold fell about 13% in two trading days, the largest two-day drop in about 30 years, and it ended 2013 down about 28%, its worst year in decades.
The miss ran the other way in 2020, when gold rallied to a record above $2,000 in August, further and faster than most desks had pencilled in at the start of the year.
Longer horizons humble everyone. Gold peaked at about $850 in January 1980 and did not beat that level in nominal terms until 2008, 28 years later; by the 1999 low of about $250-255 it had lost about 70% in dollar terms while US consumer prices roughly doubled. Forecasts miss because the drivers, which the gold drivers guide walks through, change faster than the assumptions behind the number.
Target or Trigger? The Difference That Costs Money
A trigger is a door. A target is the room beyond it. A chart forecast that says "above the pivot, gold can reach the first resistance" gives you a door (the pivot) and a room (the resistance). Buying before price goes through the door, because you like the room, is the most common way a good forecast produces a bad trade.
The reverse error is just as expensive. Some readers treat a year-end target as a trigger, buy the day a bank publishes it, then sit through months of drawdown because "the target has not been hit yet". A twelve-month target says nothing about the path, and gold's path is rough: a daily range of 1-2% is ordinary, $30-60 a day at the example price of $3,000, in both directions. The gold technical analysis guide shows how those levels are built.
How to Read ForexR's Daily XAU/USD Forecast
Every daily forecast on the gold analysis hub follows one fixed layout, so once you have read one you can read them all in two minutes:
- Live price snapshot: price, day change, day range and the daily ATR (the average size of a day's move over the last 14 days), which is your ruler for everything below.
- Key levels table: the daily pivot, three resistance and three support levels, the previous day's high and low, and the 20-day high and low.
- Annotated chart: the same levels drawn on price.
- Two scenarios: a bullish and a bearish case, each with a trigger, a target and an invalidation level. Both are written every day, because nobody knows which one the session will pick.
- A UTC timestamp: the time the data was taken. Gold can cover much of its daily range in one busy hour, so a forecast from six hours ago describes a different market.
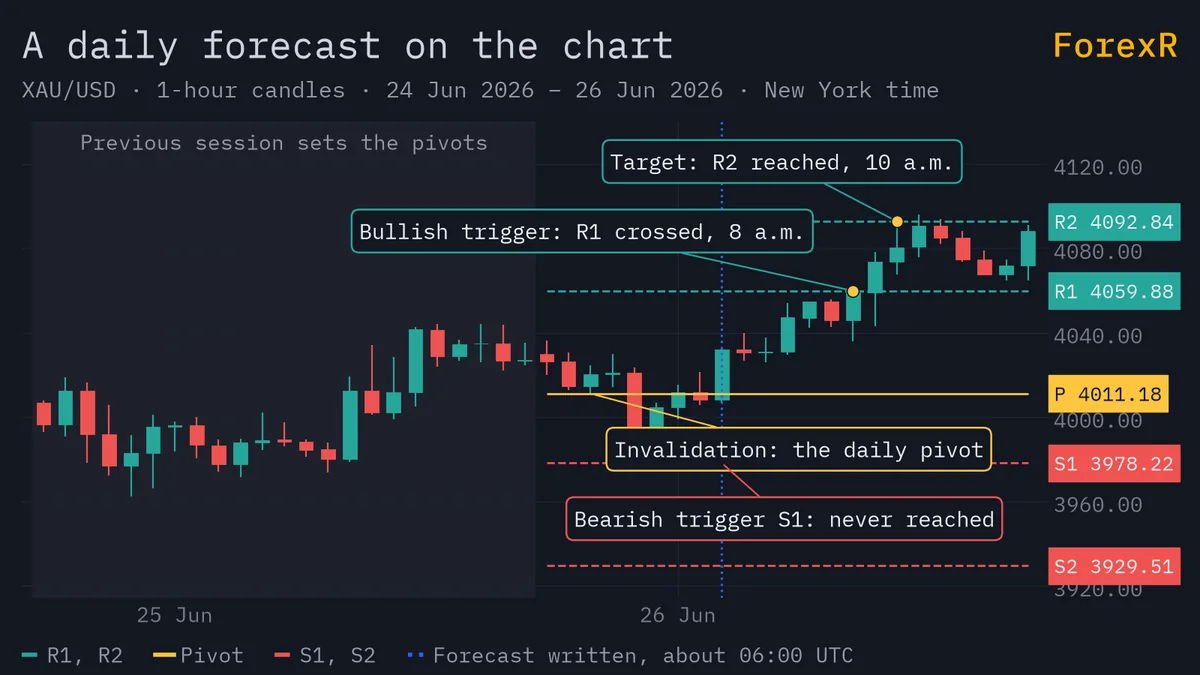
An automated engine produces the forecasts from live market data; they are published under named ForexR analyst bylines, with the method public at the methodology page, and they are analysis, not investment advice. The guide to using market analysis covers how to fit any daily piece into a routine.
A Worked Example: Turning a Scenario Into a Plan
Take an example price of $3,000 an ounce (an example, not a forecast) and a daily ATR of $40. Suppose the bullish scenario reads: trigger, a close above the pivot at $3,010; target, the first resistance at $3,050; invalidation, $2,990. From the trigger, that is $40 of potential gain against $20 of risk, a reward-to-risk of 2:1. The risk-reward calculator does the division.
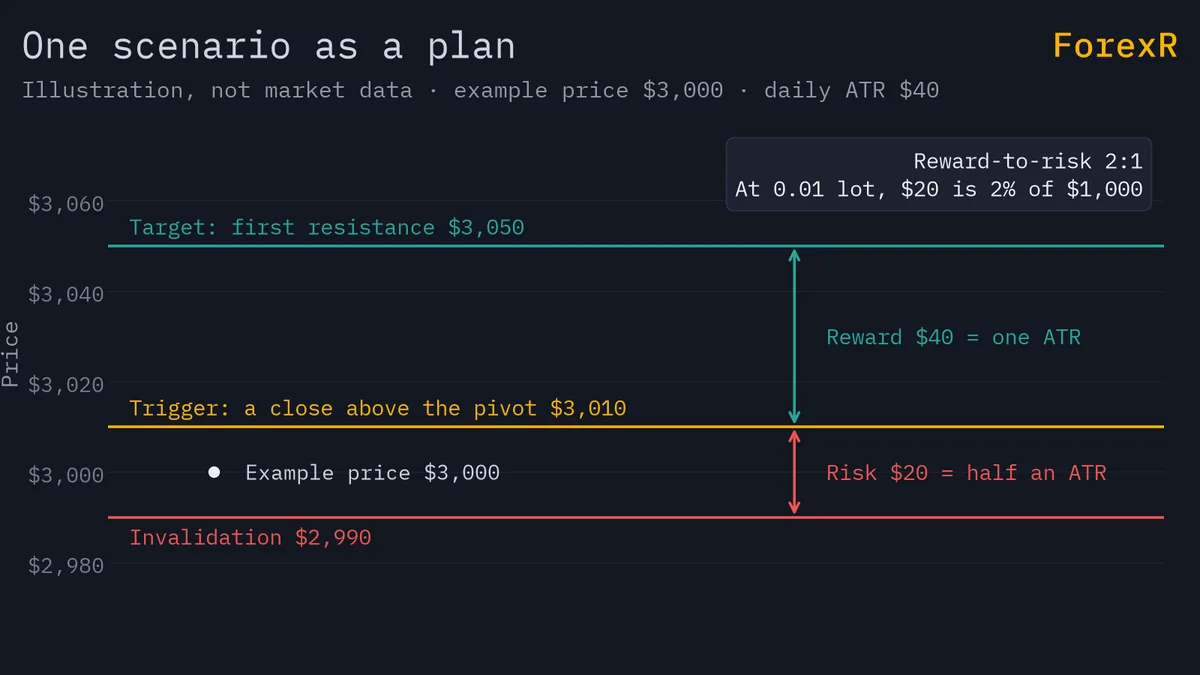
Now notice what the numbers do not say. A $20 stop is half of one ATR, so ordinary noise can hit it before the target is reached. The target is one ATR away, so it may take more than a session. At 0.01 lot, that $20 risk is 2% of a $1,000 account. The scenario tells you where; your position size tells you whether.
A warehouse supervisor in Penang reads the forecast on the bus at 7 a.m., writes both triggers into his phone, and does nothing until the London-New York overlap, when he checks whether either level has been crossed. Most days neither has, and he closes the app. That patience is the whole skill.
How to Use a Forecast as a Map, Not an Order
Maps show the roads; they do not tell you to drive. Use a forecast to mark the levels where something might happen, decide in advance what you will do at each, and let the price choose. Try this in five minutes: open today's forecast and copy both scenarios' trigger, target and invalidation onto paper, with the ATR. Tomorrow, write down which scenario played out, or whether neither did. After two weeks you will have your own record of how often the map matched the road. Check the levels against the live chart, pivots and ATR on the live gold page, and before any of it becomes a trade, check the gold spread and swap in the broker comparison, because they differ widely.
No forecast, including ours, removes the risk. Leveraged gold CFDs carry a high risk of loss, gold can fall hard and fast, as 2013 showed, and a forecast that is right about the target can still stop you out on the path. Only risk money you can afford to lose.
FAQ
Are gold price forecasts accurate?
Not reliably, on any horizon. Bank year-end targets have missed by large margins in both directions, as in 2013 when gold fell about 28% while many desks expected gains. Short-term chart levels are conditional statements rather than predictions. Judge a forecast by whether it shows its assumptions and names what would prove it wrong, not by whether it sounds confident.
What is the difference between a bullish and a bearish scenario in a gold forecast?
A bullish scenario describes what would need to happen for gold to rise, with a trigger level that activates it, a target it could reach and an invalidation level that cancels it. A bearish scenario is the mirror image for a fall. A daily forecast gives both because the writer does not know which way the session will go; the price picks one, or neither.
How often is a gold price forecast updated?
It depends on the kind. Bank targets are revised a few times a year. Chart-based and model-based pieces are usually daily, and ForexR's gold hub adds session briefs and event pieces around big releases. Always check the timestamp: a forecast written before a US data release at 8:30 a.m. New York time can be out of date within minutes of it.
Can I trade directly from a gold price forecast?
You can, but the forecast only tells you where a level sits. It does not tell you how many lots to trade, where your stop fits against the day's ATR, or whether your account can absorb the loss if the invalidation level is hit. Treat the levels as places to make a decision you planned in advance, and size the trade from your own risk rule.