MT5 101: Add Indicators and Draw Lines on an MT5 Chart

How Do You Add an Indicator and Draw Lines in MT5?
Open Insert, then Indicators, then Trend, and choose Moving Average to add an indicator. To draw a line, pick it from the Insert menu or the Line Studies toolbar and click the chart. By the end of this lesson you will have a 50 and a 200 moving average on your chart plus a horizontal line at yesterday’s high.
What you need: MT5 connected to a demo account, and a chart you can change, which the lesson on charts and timeframes covers. If you have not installed MT5 yet, start with installing MT5 and opening a demo account. Nothing here involves a trade.
Step 1: Add a 50-Period Moving Average
An indicator is a calculation drawn on the chart from past prices. A moving average (MA) is the average closing price of the last set number of bars, redrawn as each bar closes. The moving averages guide explains how traders read it.
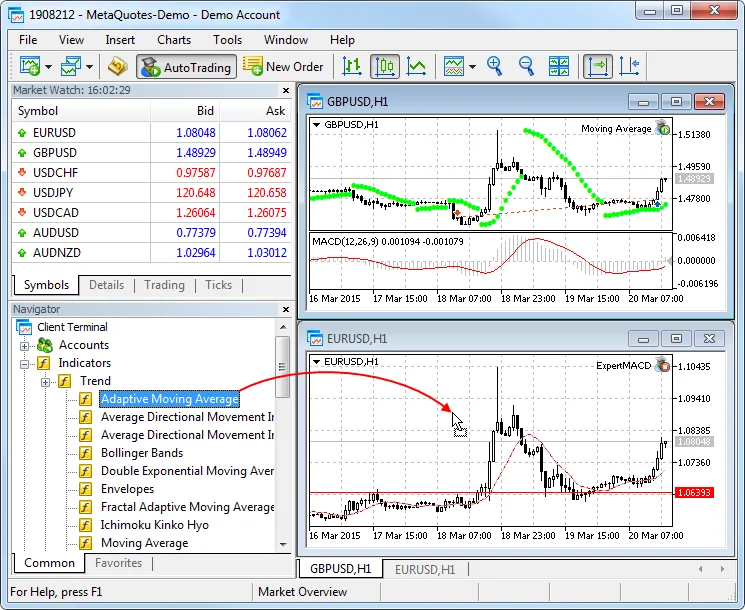
- Step 1, open the menu: click Insert, then Indicators, then Trend, then Moving Average. You can also drag Moving Average from Indicators in the Navigator onto the chart.
- Step 2, set the period: a settings window opens. Type 50 as the period. Leave the method on its default (Simple) for now.
- Step 3, choose what it averages: the Apply to field sets which price the average uses. Close is the usual choice.
- Step 4, click OK: a line appears on the price chart and follows the candles.
Step 2: Add the 200-Period Moving Average
- Repeat the same path: Insert, Indicators, Trend, Moving Average.
- Type 200 as the period: keep the same method and Apply to as before, so the two lines are comparable, then click OK.
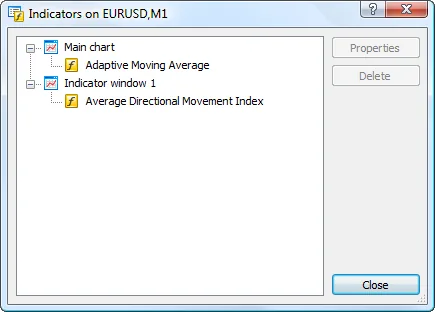
- Tell them apart: both lines look alike at first. Press Ctrl+I to open the Indicator List, select one, and open its properties to change its settings, including the look of the line.
- Read the picture: the 50 reacts faster, the 200 is slower. Price above both is one picture, below both another. Neither line predicts anything on its own.
Step 3: Manage and Remove Indicators
- Open the list: Ctrl+I shows every indicator on the active chart.
- Edit: choose an indicator and open its properties. The tabs are Parameters, Levels, Scale and Visualization. Visualization controls which timeframes show it.
- Delete: choose the indicator in the list and click Delete. An indicator that opens in its own sub-window, such as RSI, is removed with a right-click inside that window and Delete Indicator Window.
- Indicator on indicator: add a second indicator and set Apply to as Previous Indicator’s Data, and it is calculated from the first one instead of from price.
Step 4: Draw a Horizontal Line at Yesterday’s High
Yesterday’s high is the highest price reached in the previous day. Many traders mark it because price often reacts around such levels; support and resistance explains why.
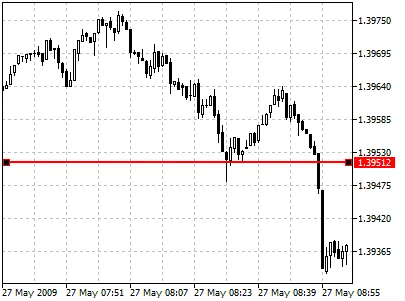
- Step 1, find the day: switch to the D1 timeframe on the Periodicity toolbar. The last full candle before the current one is yesterday. Its top wick is the high. You can switch back afterwards; the line stays on the chart.
- Step 2, pick the tool: open the Insert menu or the Line Studies toolbar and choose the horizontal line.
- Step 3, click once: a horizontal line is a one-point object, so one click places it. Click at the top of yesterday’s candle.
- Step 4, snap to the exact price: in Tools, then Options, on the Charts tab, the magnet sensitivity setting snaps anchor points to the open, high, low or close of a bar. Set to 0, it is switched off.
- Step 5, check it: the line should touch the very top of that wick. If not, drag it.
Step 5: Select, Move, Copy and Delete Objects
- Select: by default, double-click an object. A single click can be enabled with the select-by-single-click option on the Charts tab of Options.
- Move: drag its central marker. Dragging an end marker changes the drawing itself, which matters for a trend line.
- Copy: hold Ctrl and drag the central marker.
- Delete and undo: Backspace removes objects one by one, newest first, and Ctrl+Z restores a deleted object.
- List them all: Ctrl+B opens the Object List, where you can select an object and click Edit, or right-click an object and choose Properties.
A trend line works the same way, except you click, drag and release. The trend lines and channels guide shows where to place one.
The Four Indicator Families
MT5 ships 38 built-in indicators in four groups. Trend indicators, such as Moving Average, Bollinger Bands and Ichimoku, show direction. Oscillators, such as RSI, MACD and Stochastic, sit in their own sub-window and show momentum; see the RSI guide. Volumes and Bill Williams indicators are the other two groups. A beginner can stay with one trend indicator and one oscillator, because more lines usually add noise.
Chart reading in general is covered in how to read a forex chart. If you use TradingView too, the moving average scripts in the Pine Script Library are TradingView versions and do not run in MT5. Brokers differ in symbols and data history, and the broker comparison shows which offer MT5.
If Something Goes Wrong
- “I cannot select the line”: selection needs a double-click by default. Double-click it, or enable single-click selection in Options.
- “The line jumped to the wrong price”: the magnet snapped it to a nearby open, high, low or close. Lower the magnet sensitivity or set it to 0.
- “The moving average is missing”: press Ctrl+I and check it is listed for this chart. Indicators belong to one chart, not all.
- “The 200 line is short or absent”: the chart needs at least 200 bars of history. Scroll left so the terminal can load more.
- “I deleted the wrong object”: press Ctrl+Z.
What You Just Learned
- Insert, Indicators, Trend, Moving Average adds an indicator, and the period decides how fast it reacts.
- Ctrl+I lists, edits and deletes the indicators on a chart.
- A horizontal line is one click; a trend line is click, drag, release.
- Objects are moved by the central marker, copied with Ctrl, and removed with Backspace.
The next lesson, placing your first trade in MT5, opens a small demo position with a stop-loss and take-profit. Leveraged trading in forex and CFDs carries a high risk of losing money, so practise everything here on a demo account first.
FAQ
How do I add a moving average in MT5?
Click Insert, then Indicators, then Trend, then Moving Average. Type the period, such as 50 or 200, choose the method and the price it applies to, and click OK. You can also drag Moving Average from the Navigator onto the chart. Repeat the steps with a different period to add a second line.
How do I remove an indicator from an MT5 chart?
Press Ctrl+I to open the Indicator List, select the indicator and click Delete. If the indicator sits in its own sub-window, such as RSI, right-click inside that window and choose Delete Indicator Window. Deleting an indicator on one chart does not change other charts.
Why can I not select a line I drew in MT5?
By default MT5 selects objects with a double-click, not a single click. Double-click the line to select it, then drag its central marker to move it. You can switch to single-click selection in Tools, Options, on the Charts tab. Ctrl+B opens a list of every object on the chart.
What does the magnet setting do in MT5?
Magnet sensitivity, found on the Charts tab of Options, snaps the anchor points of an object to the open, high, low or close of a nearby bar. It helps place a line exactly on a high or low. A value of 0 switches the magnet off, so the line stays where you click.