MT5 Mobile 101: Charts, Timeframes, Indicators and the Ruler

How Do You Read a Chart in the MT5 App?
Open a chart from the Quotes tab, pinch to zoom and drag to scroll, pick a timeframe from the top panel and choose candlesticks in the chart settings. Indicators and drawing tools have their own buttons. By the end you will have a full-screen landscape candlestick chart with two moving averages and a swing measured with the crosshair ruler.
What You Need
The MetaTrader 5 app connected to a demo account with a few symbols in Quotes, which the previous lesson set up. If candles, bars and timeframes are new words, read how to read a forex chart first; this lesson is about where the buttons are, not what the shapes mean.
Step 1: Open a Chart and Move Around It
- Step 1, open it: in Quotes, tap a symbol and choose Chart. On iPhone the Chart tab at the bottom then shows that symbol; on Android, Charts is in the bottom panel.
- Step 2, change the symbol without leaving: tap the symbol name at the top of the chart and pick another from the list.
- Step 3, scroll and zoom: drag sideways to move through history; pinch two fingers apart to zoom in and together to zoom out.
- Step 4, lock the vertical scale: open the chart menu (Android: tap the chart for the radial menu; iPhone: the context menu) and enable Auto-scale, so the chart moves only sideways and fits the price range on screen. Free chart movement puts it back. Reset vertical scale undoes any manual stretching.
Step 2: Pick Your Timeframes and Chart Type
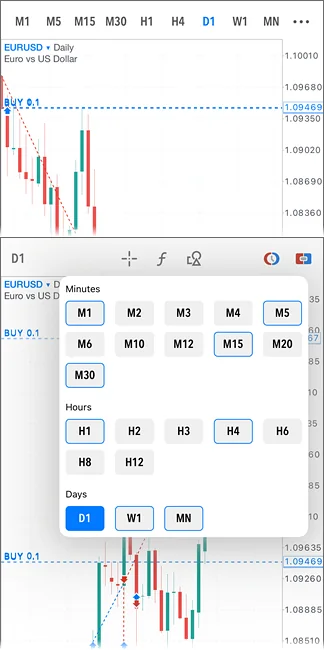
- Step 1, switch timeframe: tap the button on the top panel that shows the current period, for example H1, and pick another. There are 21, from M1 (one-minute bars) to monthly. On Android the radial menu offers them too.
- Step 2, keep only the ones you use: tap the set-up icon in the timeframe menu, then long-press a timeframe to add it to, or hide it from, the quick list. Up to nine fit. A short press switches to it. Start with M15, H1, H4 and D1.
- Step 3, choose a chart type: open the chart settings (Android: the settings icon in the radial menu; iPhone: the chart settings button in the context menu) and pick one of four: Bar, Candlestick, Line (close prices joined up) or Heikin Ashi (smoothed, synthetic candles). Choose Candlestick for this series.
- Step 4, set a minimum bar width: in the same settings, so zooming out stops before the candles become a smear.
Step 3: Add Two Moving Averages
A moving average is the average close of the last N bars, drawn as a line that smooths the price. Two of them, one short and one long, are the classic first indicator and the easy win for this lesson. Moving averages explains what the lines are telling you.
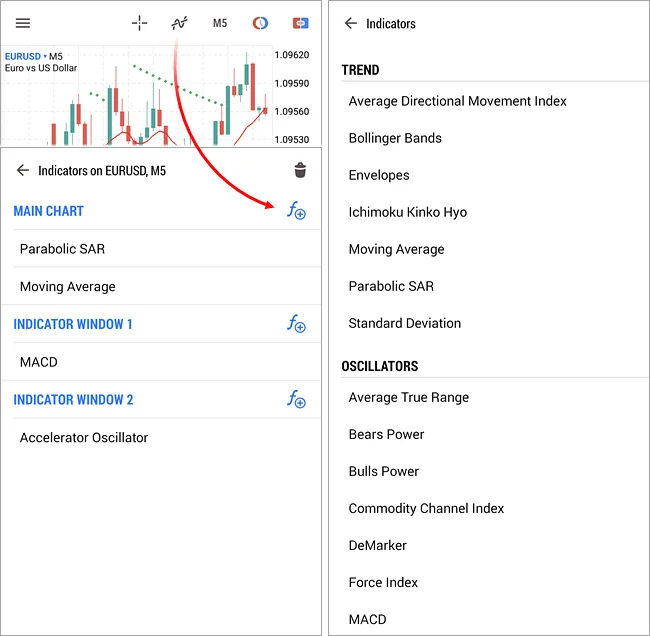
- Step 1, open the indicator list: tap the indicators button on the top panel (Android: it is also in the radial menu; iPhone: also under Indicators in the context menu).
- Step 2, add the first line: choose Moving Average and set its period to 50. Confirm and it draws on the main chart.
- Step 3, add the second: repeat with a period of 200. The two lines now show the short-term and long-term direction at a glance.
- Step 4, read exact values: enable the data window in the chart settings, then move the crosshair over any bar to see the price and both averages.
- Step 5, tidy up: remove any indicator from the same list. On Android, long-press the chart to drag the top edge of an indicator’s own window, such as RSI’s.
The app has built-in indicators only; custom ones need the desktop platform, covered in the desktop indicators lesson. The Pine Script Library’s moving average scripts are TradingView versions and do not run in MT5.
Step 4: Measure a Move With the Crosshair
The crosshair doubles as a ruler, which is how you measure a swing or the distance to a stop without any arithmetic.
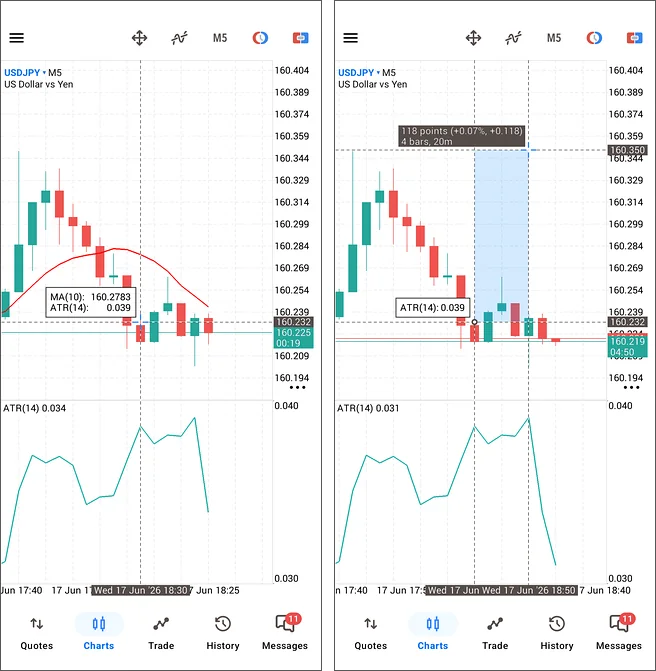
- Step 1, turn it on: tap the crosshair icon on the top panel. Drag it over the chart and read the date, time and price on the scales.
- Step 2, tap a second point: Android draws a rectangle between the two points; iPhone shows a tooltip. Either way you get the vertical distance in points, the percentage change and the number of bars between them, and on Android the time difference as well.
- Step 3, adjust and switch off: on Android drag the points or the rectangle’s edges to refine the measurement. Tap the crosshair icon again to leave the mode.
- Step 4, draw a level to come back to: tap the objects button and add a horizontal line at a recent high or low. Support and resistance explains which levels are worth marking.
Chart Settings Worth Changing
- Landscape and full screen: rotate the phone and full-screen mode switches on by itself. On iPhone, tap the chart to switch between full-screen and normal. On Android, the maximise button enlarges one chart in portrait, and the Tile windows menu switches between several open charts.
- Trading levels: show positions, orders, stop-loss and take-profit lines on the chart. You will need them switched on in the next lesson.
- Display: OHLC values at the top, period separators, the ask line (the price you buy at) and tick or real volume where the broker supplies it.
- Colours: pick a scheme you can read in daylight, such as Android’s Green on Black or Black on White.
- Bar timer (iPhone): a countdown to the close of the current bar, shown on the price scale under the current price, on every timeframe.
None of these settings change your broker’s prices or costs; the broker comparison is where those are compared. The desktop platform has the same choices under Properties, in the desktop charts lesson.
If Something Goes Wrong
- “Maximum bars limit”, or the chart will not scroll back: you have hit the device’s bar limit, about 10,000 bars on Android with 2 GB free and at least 2,000 on iPhone. Switch to a higher timeframe to see further back.
- “Go to…” appears after a timeframe change: the app kept your place in history and offers to jump back to it. Tap it or ignore it.
- The candles have turned into a thin line: you zoomed out too far. Pinch to zoom in, or set a minimum bar width in the chart settings.
- The chart stretched vertically and looks wrong: you dragged the price scale. Choose Reset vertical scale, or switch on Auto-scale.
- No stop-loss lines show on the chart: trading levels are switched off in the chart settings.
What You Just Learned
- A chart opens from any symbol in Quotes; pinch to zoom, drag to scroll, and Auto-scale keeps the price range on screen.
- The timeframe button offers 21 periods, and the set-up icon lets you keep up to nine favourites one tap away.
- Chart type, bar width, trading levels, colours and the data window all live in the chart settings.
- The indicators button adds built-in indicators such as moving averages; the crosshair measures points, percent and bars between any two points.
Next lesson: place, modify and close a trade on your phone. Forex and CFDs are leveraged products and carry a high risk of losing money, so everything in this series is practised on a demo account first.
FAQ
How many timeframes does the MT5 mobile app have?
Twenty-one, from one-minute bars (M1) up to monthly, the same set as the desktop platform. The quick list on the top panel shows up to nine of them; open the timeframe menu, tap the set-up icon and long-press any timeframe to add it to or remove it from that list.
Can I add custom indicators to the MT5 app?
No. The app comes with its built-in set of indicators and drawing objects and cannot load custom indicators or expert advisors, which are desktop features. If an indicator you want is missing, check the built-in list first, then use the desktop platform for anything custom and keep the phone for monitoring.
Why does the chart stop at a certain date on my phone?
The app keeps a limited number of bars to save memory. Android holds roughly 10,000 bars when 2 GB is free, and iPhone shows at least 2,000 before printing a maximum-bars notice. Switch to a higher timeframe, where each bar covers more time, to look further back in history.
What does the crosshair measure in MT5 mobile?
Tap the crosshair icon, place it on one point and tap a second. The app reports the vertical distance in points, the percentage change and the number of bars between them, and Android adds the time difference. It is the quickest way to size a stop-loss distance or check how far a swing travelled.