MT5 101: Open a Chart, Change Timeframe and Save a Template

How Do You Open a Chart and Change the Timeframe in MT5?
Right-click a symbol in Market Watch and choose Chart Window, then pick a timeframe from the Periodicity toolbar. By the end of this lesson you will have a candlestick EUR/USD H1 chart in colours you chose, saved as a template and as default.tpl so that every new chart looks the same.
What you need: MT5 connected to a demo account, as in installing MT5 and opening a demo account, and EUR/USD showing in Market Watch, which the screen layout lesson sets up.
Step 1: Open a Chart
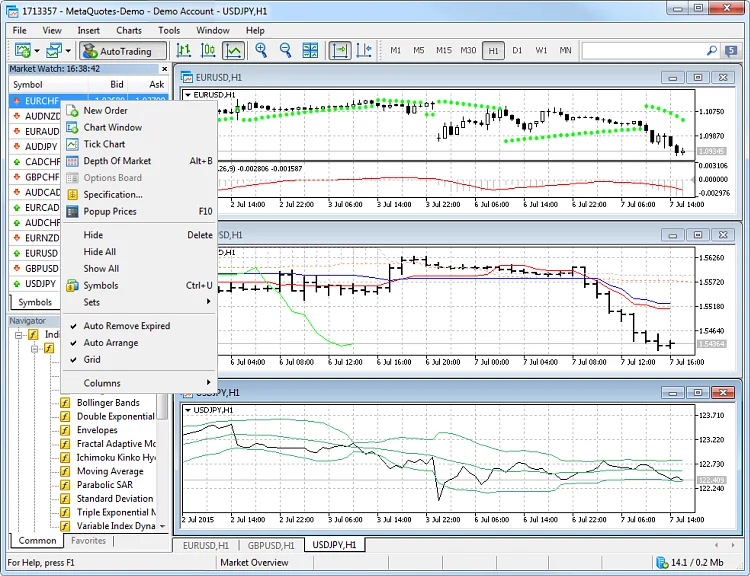
- Step 1, right-click the symbol: in Market Watch, select EURUSD, right-click and choose Chart Window. The chart opens in the chart area.
- Step 2, or drag it: drag the symbol from Market Watch into the chart area. Dragging onto an open chart swaps its symbol and keeps its settings.
- Step 3, or use File: the File menu has a New Chart command, with a button on the toolbar.
- Step 4, open a separate chart: hold Ctrl while dragging a symbol and it opens in its own window using the default.tpl template. Each open chart gets a tab on the chart switch bar.
Step 2: Change the Timeframe
A timeframe is the time each candle or bar covers. M1 is one minute, H1 is one hour, D1 is one day and MN1 is one month. MT5 offers 21 timeframes from M1 to MN1.
- Step 1, use the toolbar: click a button on the Periodicity toolbar, such as H1.
- Step 2, or use a menu: the Charts menu and the right-click menu of the chart both list the timeframes.
- Step 3, compare: switch between M15, H1 and D1 and watch the same price history redraw. Short timeframes show detail and noise; long ones show the bigger picture. Stay on H1 for this lesson.
Step 3: Choose the Chart Type and Move Around
- Chart type: press Alt+1 for bars, Alt+2 for candlesticks or Alt+3 for a line. The toolbar, the Charts menu and the right-click menu offer the same choice. Select candlesticks, where each candle shows open, high, low and close.
- Zoom: press + or −, use the zoom buttons on the toolbar, or hold Ctrl and scroll the mouse wheel.
- Move through history: Home and End jump to the ends of the history. Page Up and Page Down scroll a screen at a time, and F12 steps one bar.
- Grid: Ctrl+G switches the grid on or off.
If you want help reading what you see, how to read a forex chart explains candles, trends and the scales in detail.
Step 4: Set Your Own Colours
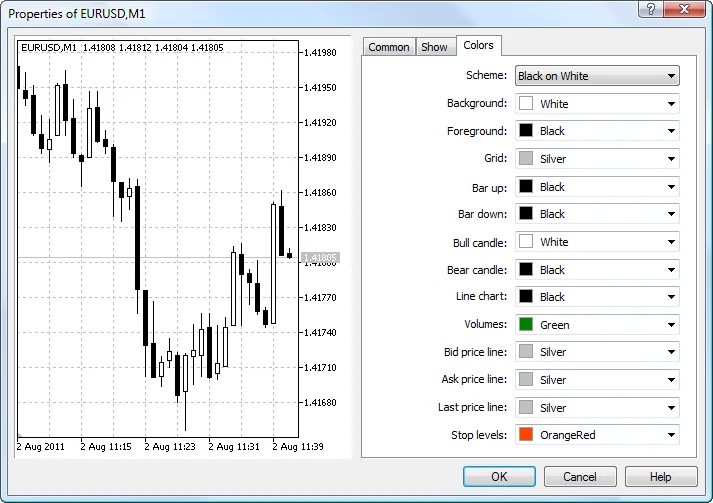
- Step 1, open Properties: press F8, or right-click the chart and choose Properties.
- Step 2, try a colour scheme: the window offers three built-in colour schemes. Pick one as a starting point.
- Step 3, set each element: set a colour for each element of the chart, such as the background, the grid and the up and down candles. Keep a light or dark background that rests your eyes, and make bull and bear candles easy to tell apart.
- Step 4, choose what to show: the properties also let you show the OHLC line, period separators and trade levels. Switch on the ones you want, then click OK.
- Step 5, read exact values: turn on the crosshair from the Line Studies toolbar and the exact price and time appear on the scales. The Data Window, one of the platform’s panels, lists the bar values for the cursor position.
Step 5: Save the Look as a Template
A template is a saved chart setup: type, colours and anything else you set. Saving one means you never redo the styling.
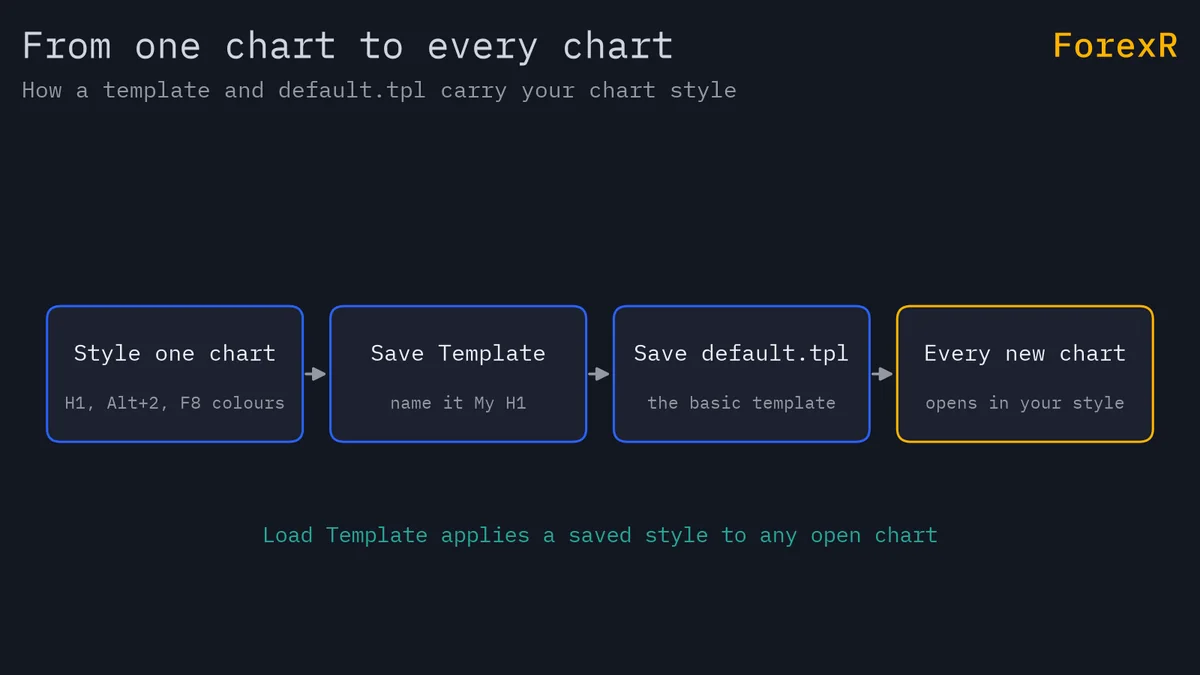
- Step 1, save it: right-click the chart and choose Templates, then Save Template. Type a name such as “My H1”.
- Step 2, make it the default: save a second copy with the name default.tpl. This is the basic template, applied automatically whenever you create a new chart.
- Step 3, apply it elsewhere: on another chart, open the Templates menu and select your template at the bottom of the list, or choose Load Template to pick a file from another folder.
- Step 4, find the file: templates are stored as TPL files in the MQL5\Profiles\Templates folder.
- Step 5, check the status bar: it shows the name of the active template and profile.
Templates and Profiles: What Is the Difference?
Think of a template as the style of one chart. A profile remembers the whole set of open charts and their positions. Open it from the File menu, or by clicking the profile name in the status bar. Save as stores the current set under a new name, Next and Previous move between profiles with Ctrl+F5 and Shift+F5, and Remove deletes one. The current profile and the DEFAULT profile cannot be deleted.
Charts come from your broker’s price feed, so history length and quotes can differ between brokers; the broker comparison is the place to look. You can check the price you are charting against the live EUR/USD rate. Indicators written for TradingView, including those in the Pine Script Library, do not run in MT5, but you can build the same idea with the built-in tools in the next lesson.
If Something Goes Wrong
- “The chart is empty or flat”: the market may be closed, or the history has not loaded. Check the status bar connection, then change the timeframe to refresh it.
- “My colours vanished on a new chart”: you saved a named template but not default.tpl. Save it again under the name default.tpl.
- “I cannot find my template”: open the Templates menu and look at the bottom of the list, or use Load Template and browse to the Templates folder.
- “The chart will not scroll to the latest bar”: press Home or End to jump along the history.
What You Just Learned
- Right-click, then Chart Window opens a chart; Ctrl+drag opens it separately.
- The Periodicity toolbar offers 21 timeframes from M1 to MN1.
- Alt+1, Alt+2 and Alt+3 switch between bars, candlesticks and a line.
- F8 opens Properties, where you pick a colour scheme or set each element.
- Templates, Save Template stores the look, and default.tpl applies it to every new chart.
The next lesson, indicators and drawing tools in MT5, adds moving averages and lines to this chart. Leveraged trading in forex and CFDs carries a high risk of losing money, so practise every step on a demo account first.
FAQ
How do I change the timeframe in MT5?
Click a button on the Periodicity toolbar, or choose a timeframe from the Charts menu or the chart’s right-click menu. MT5 offers 21 timeframes, from M1 (one minute) to MN1 (one month). The chart redraws the same price history using candles or bars of the new length.
How do I switch between candlesticks and bars in MT5?
Press Alt+1 for bars, Alt+2 for candlesticks or Alt+3 for a line chart. You can also use the toolbar, the Charts menu, the chart’s right-click menu or the Properties window. Candlesticks show the open, high, low and close of each period in one shape.
What is default.tpl in MT5?
It is the basic template that MT5 applies automatically whenever you create a new chart. If you save your own chart setup under the name default.tpl, every new chart gets your colours and settings. Templates are stored as TPL files in the MQL5\Profiles\Templates folder.
What is the difference between a template and a profile in MT5?
A template saves the look of one chart, such as type, colours and indicators. A profile saves the whole set of open charts and their arrangement. You switch profiles from the File menu or the status bar, and Ctrl+F5 and Shift+F5 move to the next or previous one.