What Moves the Gold Price? 7 Drivers Explained in Plain English

What Moves the Gold Price?
On an ordinary day gold moves 1-2%: $30-60 at an example price of $3,000 an ounce. Seven forces do most of the pushing: real yields, the US dollar, Fed policy, central bank buying, ETF and futures positioning, physical demand and supply, and fear. Real yields and the dollar decide most days; the others decide months and years.
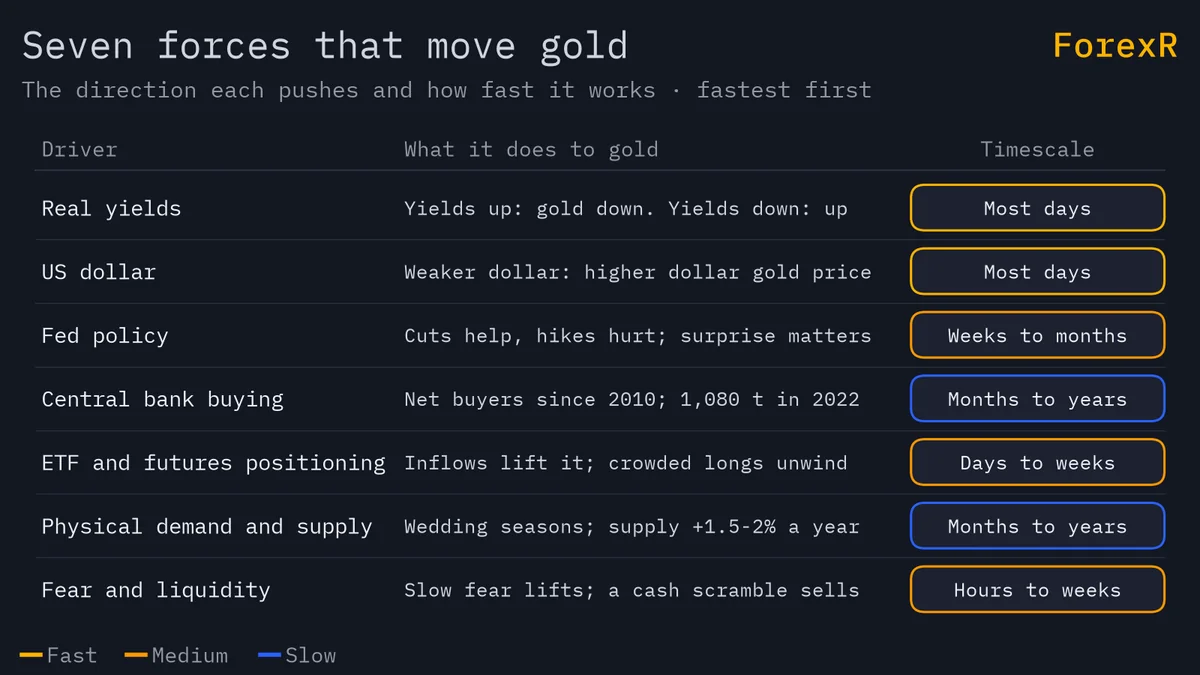
The table below sets out all seven, the direction each pushes and how fast it works. Gold has answered to these forces since it floated in 1971; why it floats is told in why gold has value. The sections run fastest driver first.
Real Yields: The Driver That Matters Most
A real yield is a bond’s interest rate minus expected inflation; the usual reference is the US 10-year inflation-protected Treasury yield. Gold pays no interest. When real yields rise, a government bond pays more for waiting and the cost of holding gold rises, so gold tends to fall; when real yields fall, or go below zero, gold tends to rise. Since the mid-2000s this has been gold’s most reliable relationship, and it is strongly negative.
Think of it as opportunity cost, the return you give up by choosing one thing over another: the interest a bond would have paid on $3,000 is the rent you pay to own an ounce that earns nothing. The full mechanism is in gold and interest rates.
The US Dollar: Pricing Effect and Shared Driver
Gold is priced in dollars, so the dollar works on it in two ways. The pricing effect: if the dollar falls 2% against other currencies and gold is unchanged for a buyer in euros, the dollar price must rise about 2%, roughly $60 on the example $3,000 ounce. The shared-driver effect: the same US interest rate moves push the dollar and gold in opposite directions at the same time.
The correlation with the US dollar index is usually negative but never fixed. When investors buy both as havens, they rise together, and that happened for long stretches in 2005 and in 2010. Gold and the US dollar covers when the link holds, when it breaks, and what gold looks like in ringgit or rupees.
Fed Policy and Inflation Expectations
America’s central bank, the Fed, sets US short-term interest rates. Cuts and easing usually help gold and hikes usually hurt it, but markets price expectations months ahead, so the reaction on the day depends on the surprise, not the decision. Gold can rise through a hiking cycle if inflation runs faster than the rate rises, as it did in the 1970s, and it can fall on a cut that is less generous than traders hoped.
What people get wrong: “gold is an inflation hedge, so a hot inflation number lifts gold.” On the day, the opposite is common: a hot CPI print pushes bond yields up, raises the real yield, and gold falls. Gold tracks inflation expectations and real yields, not last month’s consumer prices. From 1980 to 1999, too, gold lost about 70% in dollars while US consumer prices roughly doubled. Is gold an inflation hedge? tests the claim decade by decade, and the CPI guide explains the release itself.
Central Banks, ETFs and Futures: The Big Buyers
Central banks are the slow, heavy hand. Net sellers for about two decades up to 2009, they have been net buyers every year since 2010. In 2022 they bought about 1,080 tonnes, the most on record, and more than 1,000 tonnes again in 2023; in recent years they have taken about 20% of demand. Surveys by the World Gold Council cite reserve diversification and, after 2022, the freezing of Russia’s foreign reserves. The People’s Bank of China reports its reserves monthly, usually around the 7th.
Who is buying, why, and how the purchases are reported is covered in central bank gold buying.
ETFs are the fast hand. An ETF, or exchange-traded fund, is a fund whose units trade like a share; a large gold ETF buys bars as investors buy units and sells them as investors leave, so flows add or remove physical demand within days. Futures positioning, the sum of speculators’ open bets on COMEX, is the twitchy hand: it can stretch to one side and unwind sharply. In April 2013 gold fell about 13% in two trading days, the largest two-day drop in about 30 years.
Jewellery Seasons and Mine Supply: Slow Movers
Jewellery takes about 45% of yearly demand, and the two biggest markets are China and India. Buying clusters around India’s wedding seasons (roughly October to December and April to May), Dhanteras and Diwali in October or November, Akshaya Tritiya in April or May, and China’s Lunar New Year in January or February. They are known in advance and spread over weeks, so any monthly tendency is weak evidence and not a trading strategy.
Whether those buying seasons show up in prices is tested in gold seasonality.
The tonnes behind each source and use are in gold supply and demand.
Mine supply matters even less on a trading timeframe. Mines produce about 3,500-3,700 tonnes a year and recycling adds about 1,200-1,300, which grows the above-ground pile by only about 1.5-2% a year. Because almost every ounce ever mined still exists, a mine strike or a new discovery barely registers on the daily chart.
Fear and Liquidity: Why Gold Sometimes Falls in a Panic
Slow-burning fear lifts gold: sanctions, wars, currency crises, worries about banks. Sudden panic can do the reverse, because liquidity, how easily something turns into cash, is what everyone needs in a crash, and gold is the easiest thing to sell. In 2008 gold touched about $1,000 in March and fell to about $700 by October-November, about 30%, as funds sold everything to meet margin calls. In March 2020 it fell about 12% in about eight trading days for the same reason, then rallied to a record above $2,000 in August 2020 once central banks flooded the system with liquidity.
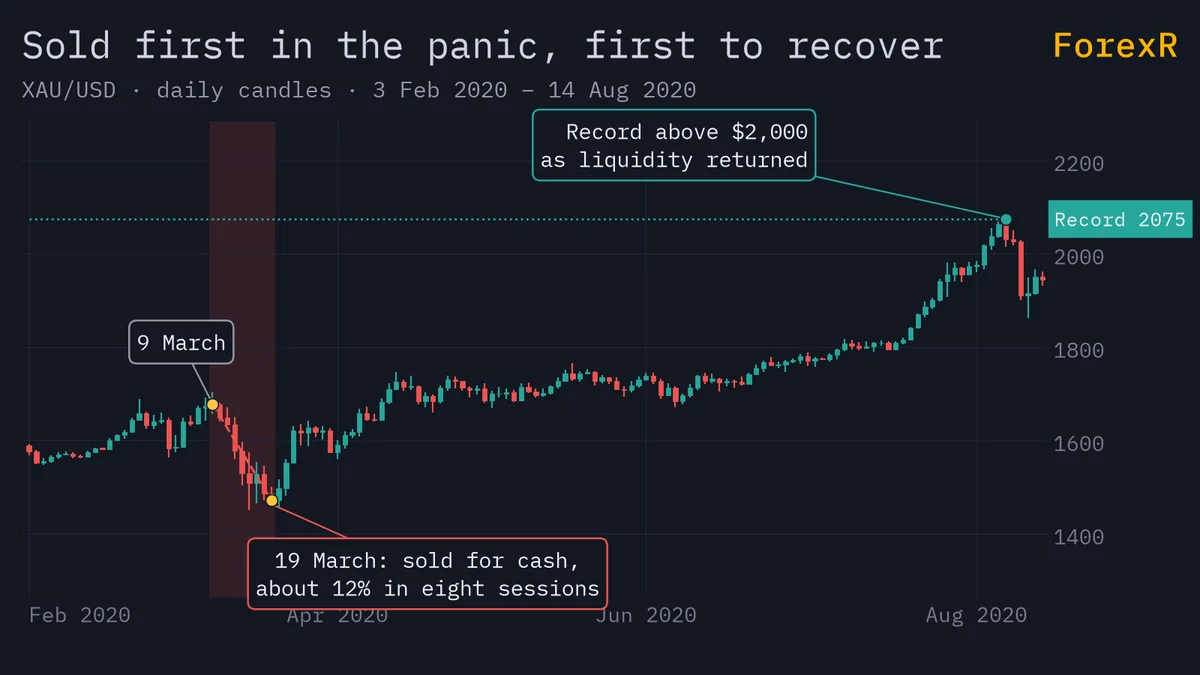
Memorise the pattern: in a liquidity crunch gold is sold first because it can be sold, and it usually recovers first once liquidity returns. Gold as a safe haven sets out when the haven label works and when it fails.
Which Driver Is in Charge Today?
An accountant in Jakarta trades gold part-time. Before he touches a chart, he writes two arrows on a sticky note: US 10-year real yield up or down, dollar index up or down. Then he checks whether US data is due. On a CPI night that is 7:30 p.m. Jakarta time in US summer, so he closes his laptop until the first fifteen minutes after the release have passed.
His routine is the right order, because the drivers work on different clocks. A monthly phone bill is a fair picture: the plan price (real yields) sets most of it, the currency you pay in (the dollar) shifts it, roaming charges (fear shocks) spike it, and the handset instalment (central bank buying) sits underneath. Check in this order:
- Yields and the dollar first. If both point the same way for gold, the day has a bias. If they disagree, expect chop.
- The calendar second. CPI, NFP and Fed days rewrite the first two in seconds; how to trade gold during news covers the release-day pattern.
- Flows third. Central bank reserve reports, ETF holdings and futures positioning show who is leaning on the price this month.
- Sentiment last. The live gold page carries a Sentiment and Opportunity block, refreshed hourly, with news tone in % bullish and bearish and a composite score from −100 to +100, labelled informational only.
Try This: Five Days of Yield-and-Dollar Guesses
For five trading days, before you look at gold, note whether US 10-year yields and the dollar closed up or down the day before, and write your guess for gold’s direction. Then check the actual close; the currency strength meter gives you the dollar side in one glance. The guess will probably be right more often than not but far from always, which is the right level of respect for these drivers. Before testing it with real spreads, compare regulated brokers on their gold costs.
Whatever the drivers say, gold can fall hard and fast: about 30% in late 2008 and about 12% in eight days in March 2020. Leveraged gold CFDs carry a high risk of loss, and a driver that worked for a year can stop working the week you rely on it. Risk only money you can afford to lose.
FAQ
Does gold go up when interest rates go up?
Usually the opposite, but the detail matters. Gold responds to real yields, the bond rate minus expected inflation, and to what markets already expect. If the Fed raises rates but inflation rises faster, real yields fall and gold can climb, as in the 1970s. If a rate rise surprises the market, yields jump and gold usually drops that day. Watch the surprise, not the headline.
Can gold and the US dollar rise at the same time?
Yes. The usual link is negative, because gold is priced in dollars and both respond to US rates, but when investors buy both as havens they rise together. That happened for long stretches in 2005 and in 2010. Treat the dollar as a filter that tilts the odds rather than a rule, and check real yields as well before assuming a strong dollar means weaker gold.
Does jewellery demand from India move the gold price?
Over years, yes: India is one of the two largest jewellery markets and jewellery takes about 45% of demand. Over days, barely. Wedding seasons and festivals are known in advance and buying spreads over weeks, so it is already in the price. Historical monthly patterns around Diwali or Akshaya Tritiya are weak evidence. Real yields and the dollar decide the week, not the calendar of festivals.
How can I tell if gold will go up tomorrow?
You cannot know, but you can build a bias. Note the direction of US 10-year real yields and the dollar, check the economic calendar for CPI, jobs or Fed events, and read the day’s key levels and scenarios on the gold analysis hub, which states a trigger and an invalidation for each. A bias tells you which side to prefer and where you are wrong; it is not a prediction.