Gold Correlations: Dollar, Yields, Silver, AUD and Bitcoin

What Are Gold Correlations and Why Do They Matter?
Six screens on one desk: gold, the dollar index, US real yields, silver, AUD/USD and bitcoin. Some move together, some move apart, one wanders off alone. A gold correlation is a number from −1 to +1 that says how often two of those screens moved the same way. It tells you whether your gold trade is one bet or three.
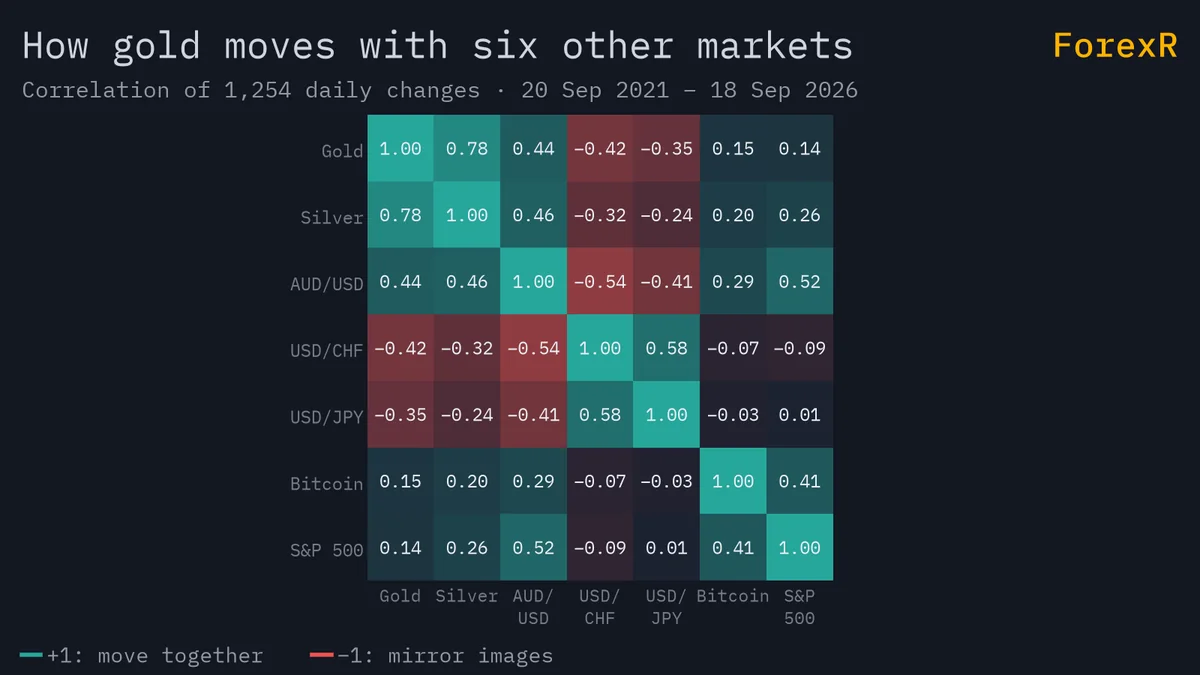
Correlation measures co-movement, not cause: +1 means two prices moved the same way every time in the sample, −1 always opposite, 0 no pattern. The currency correlation guide explains the maths and the traps; this guide covers which numbers gold keeps and which it drops.
- US dollar index: negative, moderate.
- US 10-year real yields: strongly negative, gold’s most reliable link.
- Silver: strongly positive, about +0.7 to +0.9.
- AUD/USD: positive, moderate.
- Swiss franc: positive; the yen: mixed.
- Oil: weak positive.
- US shares: near zero most of the time.
- Gold miners: same direction, two to three times the size.
- Bitcoin: unstable, mostly near zero.
Each of those is a tendency measured over years, not a law, and each has broken at least once in a way that hurt somebody.
Gold and the US Dollar: Usually Opposite, Not Always
Gold is priced in dollars, so a weaker dollar lifts the dollar price of gold even when gold has not moved in euros or yen. The same US interest-rate news also drives both. The result is a negative, moderate correlation with the dollar index, covered in gold and the US dollar and the DXY guide.
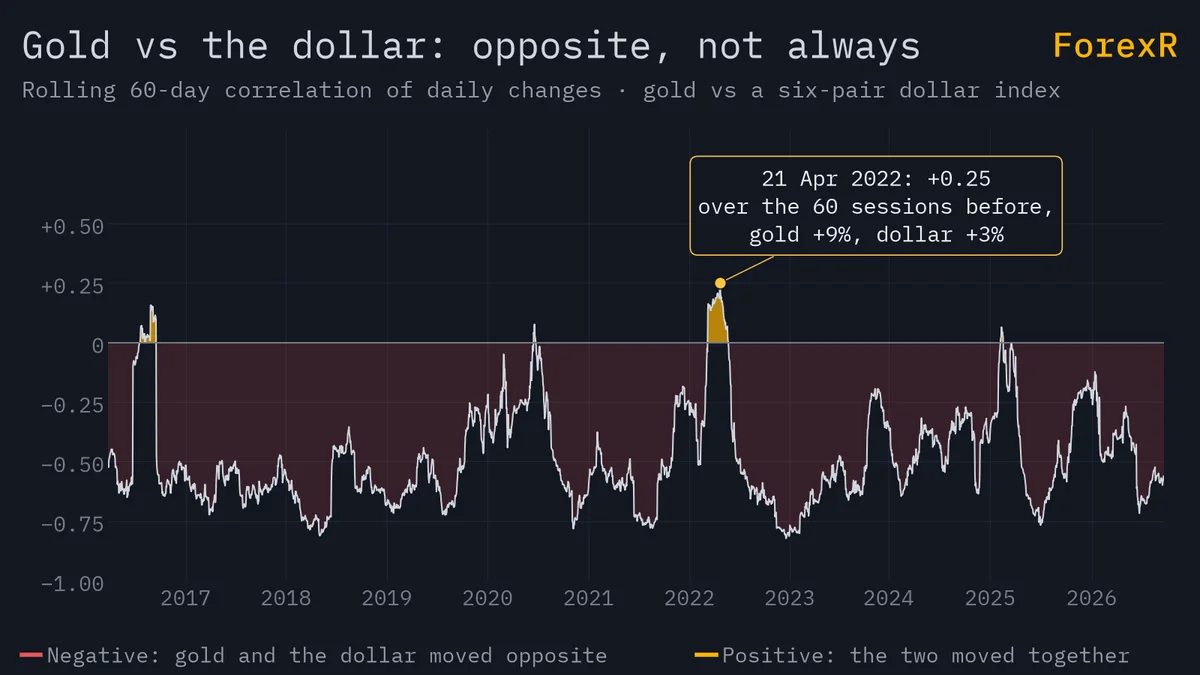
Here is the fact that surprises most traders: in 2005 and again in 2010, gold and the dollar rose together for long stretches. Both were being bought as havens at once, so the “opposite” rule simply switched off, and it has happened again in later years. A trader who shorted gold then because the dollar was rising was fighting a correlation that had already left the room.
Gold and Real Yields: The Link That Holds Best
A real yield is a bond’s interest rate minus expected inflation; the US 10-year inflation-protected Treasury yield is the usual reference. Gold pays no interest, so when real yields rise, holding gold costs more in missed income and gold tends to fall; when they fall, gold tends to rise. Since the mid-2000s this has been gold’s most reliable relationship, and it is strongly negative.
Why does it hold better than the dollar link? Because it sits closer to the cause: the dollar and gold share a driver, and real yields are the driver. If you only have time to check one thing before a gold trade, check which way real yields are heading. The gold and interest rates guide has the bond-versus-ounce arithmetic.
Gold and Silver, AUD/USD and the Havens
Silver is gold’s closest relative. The two share a correlation of about +0.7 to +0.9, but silver swings roughly twice as far in percentage terms because its market is far smaller and half its demand is industrial. That gap is what the gold-silver ratio measures.
AUD/USD is moderately positive with gold for a plain reason: Australia is a top gold producer, so a higher gold price supports its export income and currency. Put the live AUD/USD page next to gold and you will often see the same shape on the day.
The Swiss franc is positive with gold because both are bought in slow-burning fear, so USD/CHF and gold tend to move opposite. The yen is mixed: sometimes a haven partner, sometimes driven by Bank of Japan policy instead. The safe-haven guide covers when these partnerships hold and when they fail.
Gold vs Oil, Shares and Mining Stocks
Oil and gold have a weak positive link through the inflation channel: dearer oil lifts inflation expectations, which can help gold. Weak means weak. Do not trade gold off an oil chart.
US shares and gold sit near zero most of the time. The number turns negative in slow fear, when money leaves shares for gold, and positive in liquidity crashes, when everything is sold for cash. In 2008 gold fell about 30%, from about $1,000 in March to about $700 by November, as funds sold anything liquid to meet margin calls.
Gold-mining shares move with gold but two to three times as much. Traders call that high beta: a leveraged version of the metal, plus company risk. A miner can fall on a bad quarter while gold rises.
Gold and Bitcoin: An Unstable Pair
People call bitcoin digital gold, so you might expect a strong positive correlation. The data say otherwise: the pair sits mostly near zero, and the sign flips from year to year. In 2022 bitcoin traded like technology shares, falling with them, while gold behaved like gold. Treat them as separate markets that occasionally rhyme; the gold vs bitcoin guide has the full comparison.
How to Use Gold Correlations Without Doubling Your Risk
Correlations have two honest uses: avoiding doubled risk and confirming a view. The first protects money, so start there.
Take a $5,000 account and a rule of 1% risk per trade, so $50. Gold is at the example price of $3,000 an ounce (an example, not a forecast). You go long 0.02 lots with a $25 stop: 0.02 × 100 oz × $25 = $50 at risk. You also go long AUD/USD risking $50 and short USD/CHF risking $50. On paper that is three trades and 3% of the account. In practice all three win if the dollar weakens and all three lose if it strengthens: one $150 bet on a weaker dollar, and a hot US inflation print can take the whole $150 in an hour.
It is like putting down three deposits on the same rental flat: three times the money tied up, one flat. Correlated positions should share one risk budget. If your limit per idea is 1%, split the $50 across the three legs, or pick the cleanest one.
Confirmation is the second use. If gold is breaking out while the dollar index is breaking down and real yields are slipping, the move has support from its usual drivers. If gold is rising while the dollar and yields also rise, be careful: unusual moves reverse hard. The currency strength meter shows whether the dollar is weak across the board or only against one pair.
What People Get Wrong About Correlation
The common belief is that a correlation is a rule: “gold and shares are unrelated, so gold protects a share portfolio in a crash.” It fails in two ways. A near-zero average hides the extremes, and correlations are measured over a window that can change fast. A 30-day number computed in a calm month says little about the next crash week.
Evidence: in March 2020 gold fell about 12% in about eight trading days alongside shares, as investors raised cash. The gold-shares correlation had been near zero the month before and turned sharply positive in the one week it mattered. Once central banks added liquidity, gold recovered first and ran to a record above $2,000 in August 2020. Correlations describe the past sample; they do not promise the next one.
Try This: A Five-Minute Correlation Check
Picture a part-time trader in Penang who checks gold at 10 p.m. after the children are asleep. Before she opens a position she writes three lines on paper: dollar index, AUD/USD and silver, each up or down today. If gold agrees with all three she takes her normal size; if it disagrees with two, she halves it or waits. Two minutes a night.
Your version: open the live gold page and note the day change, then do the same for AUD/USD, USD/CHF and silver. Mark a plus where each agrees with gold’s direction under the usual relationship and a minus where it disagrees. Do it daily for two weeks in a demo journal and you will see how often the “rules” hold. Whichever broker you pick from the broker comparison, the check costs nothing.
A closing word on risk. Correlations can turn a set of small positions into one large one without you noticing, and gold itself can fall hard and fast, as 2008, 2013 and March 2020 showed. Leveraged gold CFDs carry a high risk of loss. Only risk money you can afford to lose.
FAQ
How do I calculate the correlation between gold and another market?
Take 30 to 90 daily closes for gold and for the other market, turn each into daily percentage changes, and run a correlation function in a spreadsheet on the two columns. The result runs from −1 to +1. Recalculate it monthly, because the number drifts, and never trust a figure built on fewer than about 30 days.
Which currency pair is most correlated with gold?
AUD/USD is the pair most often quoted, with a moderate positive link because Australia is a major gold producer. USD/CHF usually runs the opposite way to gold, since the franc and gold are both bought in fear. None of these links is strong enough to trade one as a proxy for the other.
Does gold go up when the stock market crashes?
Not at first, usually. In the sharpest crashes, such as autumn 2008 and March 2020, gold fell with shares because funds sold anything liquid to meet margin calls. Gold then recovered ahead of shares once central banks added cash. In slower sell-offs driven by fear rather than forced selling, gold has more often risen while shares fell.
Can I hedge a gold position with a correlated currency pair?
Only partly. A short AUD/USD against a long gold position offsets some dollar-driven moves, but the correlation is moderate, so the hedge leaks on most days and can fail completely when the relationship breaks. You also pay two spreads and two swaps. A stop-loss on the gold trade is a cheaper and more reliable way to cap the risk.