How to Backtest an EA in the MT4 and MT5 Strategy Tester

How do you backtest an EA in MetaTrader?
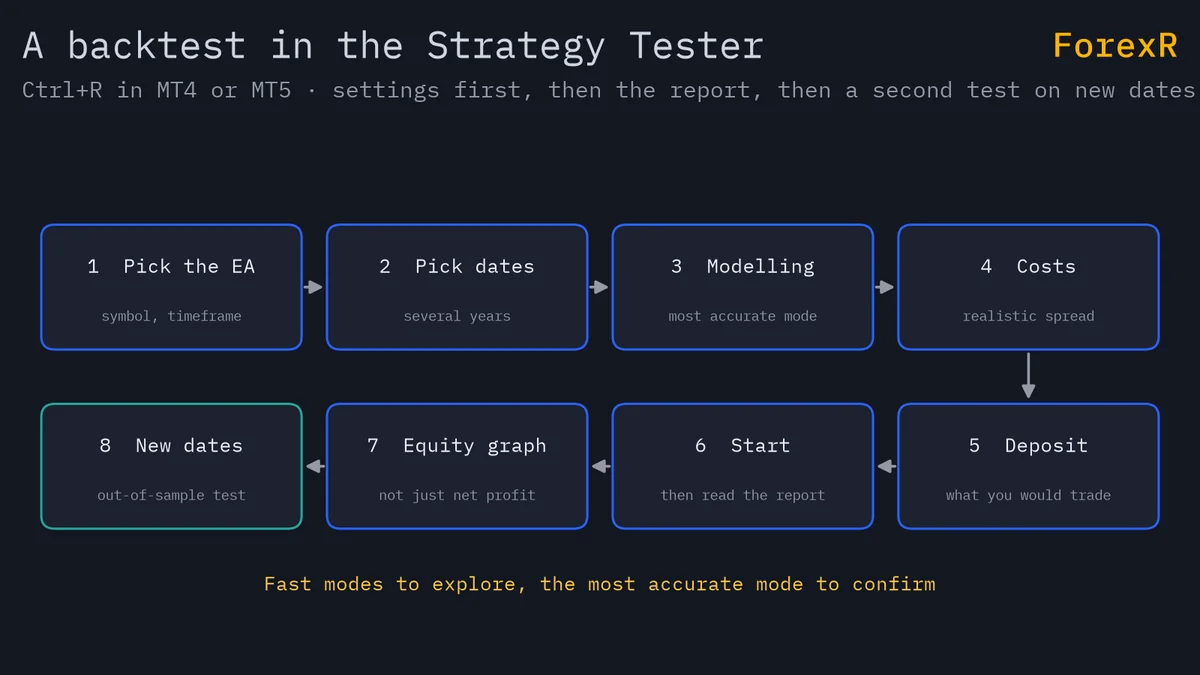
To backtest an EA, open the Strategy Tester with Ctrl+R, pick the EA, symbol, timeframe and dates, choose the most accurate modelling mode your data allows, set a realistic spread and deposit, then press Start. Afterwards, read the report and the equity graph, not just the net profit, before you trust the result.
A backtest replays the EA on past prices. It shows how the rules would have behaved, not how they will behave next. Our guide to backtesting and keeping a trading journal covers the general ideas; this one covers the tester. The EA Library lists open-source EAs to practise on, and our guide on installing an EA in MT4 and MT5 gets one onto your platform.
How to open the Strategy Tester in MT4 and MT5
In both platforms, press Ctrl+R or choose View > Strategy Tester, then fill in the Settings tab:
- Expert Advisor: pick it from the drop-down list. In MT4, the Expert properties button holds the inputs and the starting deposit; in MT5, inputs have their own tab.
- Symbol and timeframe: the pair and chart period the EA was built for, such as EURUSD on H1.
- Dates: in MT4, tick Use date; in MT5, choose Custom period. Test several years of trends, ranges and news shocks.
MT4 and MT5 modelling modes: which one to trust?
The modelling mode decides how the tester fills in price movement inside each bar, which matters most for tight stops and small targets. MT4 has three modes:
- Every tick: builds ticks, the individual price changes, from the smallest timeframe in your history, usually one-minute bars. MT4's most precise mode, but the ticks are simulated.
- Control points: a rougher path from a few points of a smaller timeframe. Fine for a quick look only.
- Open prices only: uses just the opening price of each bar. Very fast, and valid only for EAs that act once per bar.
MT5 has five:
- Every tick based on real ticks: replays the ticks your broker recorded, with their real, changing spread. Trust this one for a final test, if the broker's history covers your dates.
- Every tick: simulated ticks built from one-minute bars.
- 1 minute OHLC: only the open, high, low and close of each one-minute bar. Faster, and handy for early optimisation.
- Open prices only: as in MT4.
- Math calculations: no price data at all; it cannot test a trading EA.
Explore with a fast mode, then confirm with the most accurate one.
Spread, deposit, leverage and visual mode
- MT4 spread: the spread is the gap between the buy and sell price. “Current” uses the spread at the moment you press Start for the whole test, which may be unusually wide or tight. A fixed value, in points, is more honest; on a five-digit quote 10 points make 1 pip. Use your broker's typical spread, then retest wider.
- MT5 spread: taken from the price history. Real-ticks mode uses each tick's recorded spread, including wide spreads around news and the daily rollover.
- Deposit and leverage: leverage lets you open trades larger than your margin, the deposit the broker holds. MT5 sets both in Settings; MT4 sets the deposit under Expert properties and normally uses your account's leverage. Enter what you would really trade with.
- Visual mode: watch the EA trade on a chart, to see whether it sets stop-losses and how many trades it stacks.
How to read the Strategy Tester report
- Total net profit: gross profit minus gross loss. The headline, and the least useful number alone.
- Profit factor: gross profit ÷ gross loss. Above 1.0 made money; below 1.0 lost.
- Expected payoff: net profit ÷ total trades, the average result per trade. If it is smaller than a pip or two of extra cost, the edge is fragile.
- Absolute drawdown: how far the account fell below the starting deposit.
- Maximal and relative drawdown: the biggest fall from a peak to a later low, in money (maximal) and as a percentage of that peak (relative). MT5 shows balance and equity versions; read the equity ones.
- Total trades: the sample size. A few dozen prove little.
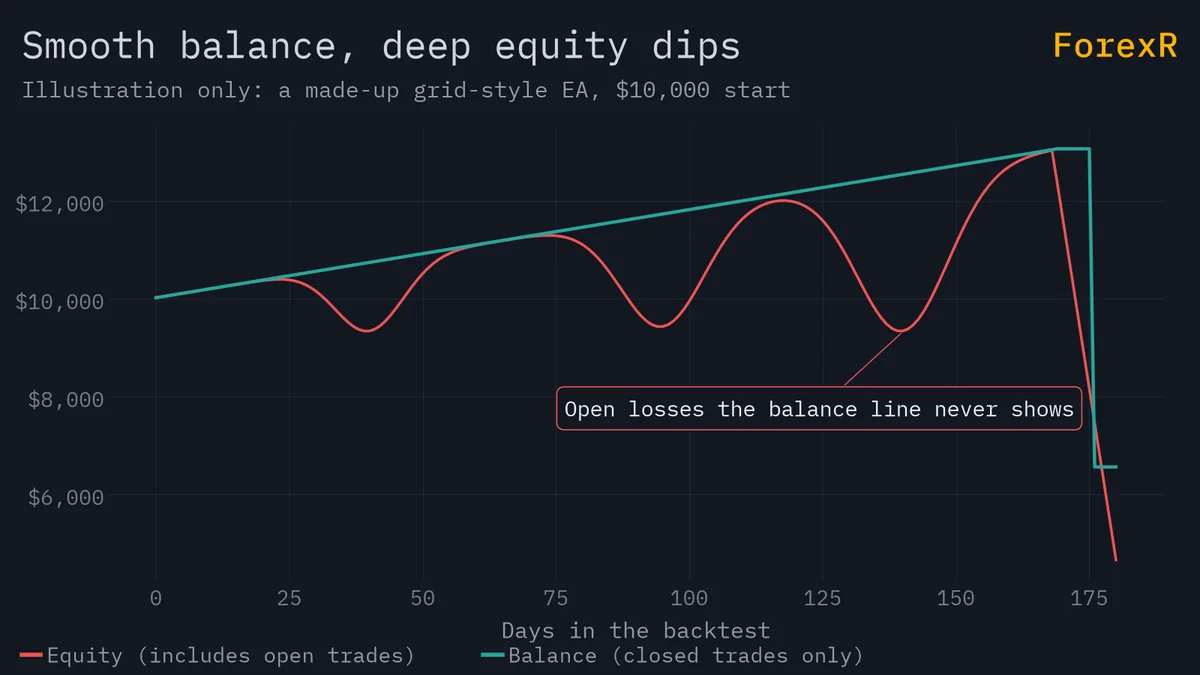
Then check the graph. Balance counts closed trades only; equity adds the profit or loss of open trades. MT5 draws both; in MT4, read the graph alongside the drawdown figures. The classic grid or martingale warning sign is a smooth, rising balance line while equity plunges far below it. Those dips are losers held open, and one strong trend can turn them into a wipe-out, as our guide to martingale and grid strategies shows. The library can hide grid and martingale EAs.
MT4 history data and modelling quality
MT4 tests only on the history stored in your terminal, which you can check and download in Tools > History Center. Missing one-minute data leaves “Every tick” with a rougher path. The report's modelling quality figure measures how complete the data was, not whether the EA is good. A low figure, or mismatched charts errors, means fix the data first. Even a high figure rests on simulated ticks, so for fast-trading EAs an MT5 test on real ticks is often more realistic.
Optimisation and the over-fitting trap
Optimisation runs the EA many times with different input values, each given a start, step and stop, and ranks the results. The trap is over-fitting: tuning inputs until they match the past perfectly. Three inputs with 10 values each give 10 × 10 × 10 = 1,000 combinations, and some will look brilliant by chance.
- Split the data: optimise on the in-sample period, the older history, then run the chosen settings once on the out-of-sample period, newer data the optimisation never saw.
- Use MT5's Forward setting: set it to 1/4 and the tester holds back the last quarter of your dates. With eight years, it optimises on the first six and tests the best settings on the last two.
- Prefer broad plateaus: pick settings whose neighbours also do well, not one sharp peak.
A worked example: reading a hypothetical report
Suppose an MT4 test of a trend EA on EURUSD H1 over eight years, with “Every tick”, a $10,000 deposit, 0.10 lots and a fixed 15-point (1.5-pip) spread. The made-up report shows:
- Gross profit $6,000, gross loss $4,800: net profit is 6,000 − 4,800 = $1,200.
- Profit factor: 6,000 ÷ 4,800 = 1.25.
- 200 trades, 100 of them winners: expected payoff is 1,200 ÷ 200 = $6.
- Drawdown: equity peaked at $11,500 and fell to $10,350, so maximal drawdown is $1,150 and relative drawdown is 1,150 ÷ 11,500 = 10%. Equity never went below $9,700, so absolute drawdown is 10,000 − 9,700 = $300.
Now stress it. At 0.10 lots, 1 pip on EURUSD is worth about $1, so a spread 1 pip wider costs the 100 winners $100 and the 100 losers another $100. Net profit becomes 5,900 − 4,900 = $1,000, expected payoff 1,000 ÷ 200 = $5 and profit factor 5,900 ÷ 4,900 ≈ 1.20. A mild drop is a good sign; if one pip had erased the profit, the edge would be too thin.
Recovering from $10,350 to $11,500 needs a gain of 1,150 ÷ 10,350 ≈ 11%. The drawdown calculator does this for any loss, and the risk of ruin calculator shows how risk per trade changes your chance of losing too much to continue.
Backtest checklist before you trust an EA
- Data: several years of trends and ranges; real ticks in MT5 or checked history in MT4.
- Costs: your broker's typical spread, then a wider one. If your costs are high, compare brokers.
- Settings: your real deposit, leverage and lot size.
- Report: profit factor comfortably above 1.0, an expected payoff bigger than a pip or two of cost, hundreds of trades.
- Graph: equity close to balance, with no deep hidden dips.
- Robustness: out-of-sample results close to in-sample ones.
An EA that passes goes to a demo account next; see running an EA 24/7 for forward testing and going live.
A backtest only shows that the rules survived the past with the data and costs you gave them; it cannot predict the next trend or news shock. Automated trading of forex and CFDs carries a high risk of loss, so only risk money you can afford to lose.
FAQ
What is a good profit factor for an EA?
Anything above 1.0 made money in the test, but a thin margin rarely survives live costs. Many traders look for a profit factor comfortably above that, often 1.3 or more, over hundreds of trades with a realistic spread. Be suspicious of very high figures from a small sample or from a grid EA, because losing trades held open can hide inside them.
Why does my EA open no trades in the Strategy Tester?
Check the tester's Journal tab first, because it usually names the problem. Common causes are a lot size below the broker's minimum, a deposit too small for the margin, missing price history for your dates, the wrong symbol or timeframe, or a time filter that only allows trading in certain hours. Some EAs also wait for conditions that rarely occur.
Is the MT5 Strategy Tester more accurate than MT4?
Usually, yes. MT5 can replay the real ticks your broker recorded, with their changing spread, while MT4 builds simulated ticks from one-minute bars and uses one fixed spread for the whole test. MT5 can also test several symbols at once. The result is only as good as the broker's tick history, so check the history quality line in the report.
Can I backtest an EA if I only have the .ex4 or .ex5 file?
Yes. The Strategy Tester runs compiled files, so you can test an EA without its source code. You will see the report and can watch it in visual mode, but you cannot read how it sizes trades or what else it does. Treat unexplained behaviour, such as lot sizes that grow after losses, as a serious warning sign.