Forex Candlestick Patterns: Pin Bars, Engulfing, Doji & More

Candle anatomy: a quick recap
Each candle records four prices for its period: open, high, low and close. The body spans the open and close; the wicks mark the high and low. A long body shows one side controlled the period from start to finish. A long wick shows that price travelled to an extreme and was pushed back before the close — a rejection. If this is new to you, start with how to read a forex chart.
Single-candle patterns
- Pin bar. A small body at one end of the candle with a long wick at the other, typically at least twice the body length. A long lower wick shows sellers pushed down and were rejected; a long upper wick shows the opposite.
- Hammer. A bullish pin bar after a decline: small body near the top, long lower wick, little or no upper wick.
- Shooting star. The bearish mirror image after a rally: small body near the bottom, long upper wick.
- Doji. The open and close are almost identical, leaving a cross shape. It signals indecision — neither side won. A doji in the middle of a range means very little; one after a long run into a key level suggests momentum is stalling.

Multi-candle patterns
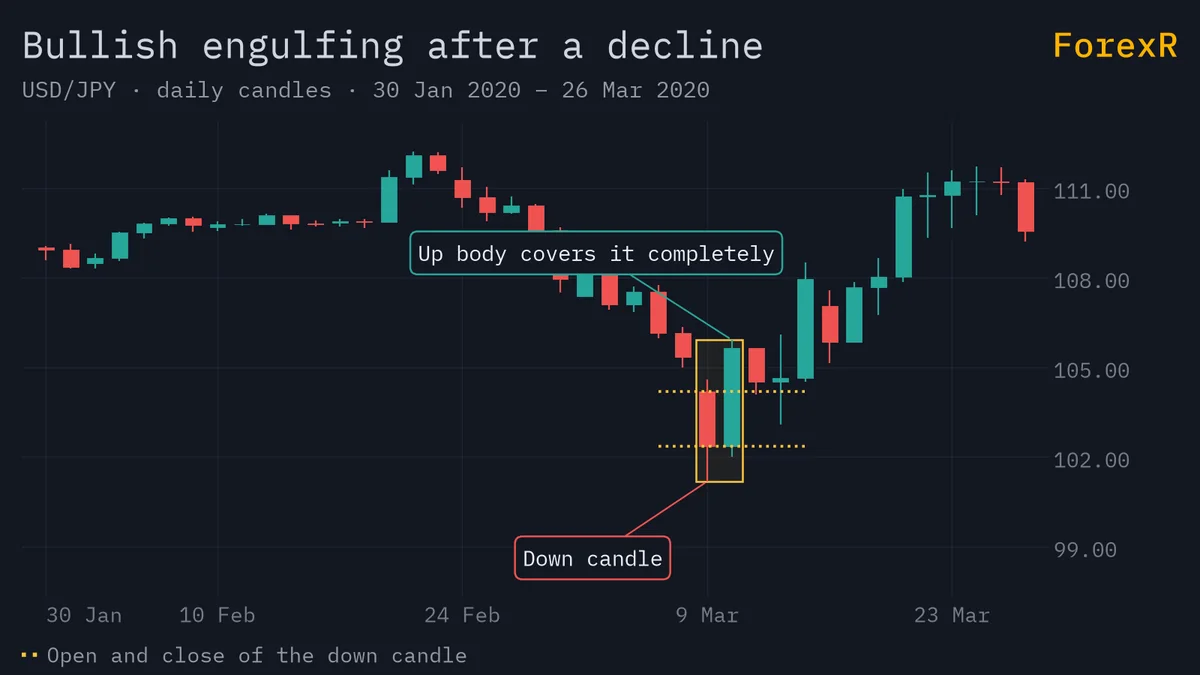
- Bullish engulfing. A down candle followed by an up candle whose body completely covers the previous body. Buyers not only absorbed the selling but reversed all of it within one period. The bearish engulfing is the reverse.
- Morning star. Three candles: a strong down candle, a small-bodied candle showing hesitation, then a strong up candle that closes well into the first candle’s body. The evening star is the bearish equivalent at the top of a rally.
- Inside bar. A candle whose entire high-to-low range sits within the previous candle (the “mother bar”). It shows contraction and a pause. Traders typically trade the break of the mother bar’s high or low, in the direction of the prevailing trend.
Because forex trades around the clock from Monday to Friday, gaps between candles are rare, so textbook star patterns that require gaps need relaxing: focus on the small middle body and the strong third close.
Context: location matters more than shape
A hammer in the middle of nowhere is just a candle. The same hammer printed at a daily support zone, after a multi-day decline, in line with the higher-timeframe trend, is a meaningful piece of evidence. Before acting on any pattern, ask three questions, the last of which relies on the ATR indicator:
- Where is it? Is the candle at a level that matters — a prior swing high or low, a pivot point, a round number, a widely watched moving average?
- What came before? A reversal pattern needs something to reverse. A shooting star after a 150-pip rally into resistance is relevant; one after three sideways candles is not.
- How large is it? Compare the candle’s range with recent volatility. If the 1-hour ATR is 18 pips, a 6-pip pin bar is noise, while a 30-pip pin bar shows real participation.

Timeframe matters too: daily and 4-hour candles summarise far more trading than 5-minute candles. Timing matters as well: candles printed in thin late-session hours carry less weight than those formed during the London or New York trading sessions.
Confirmation and trade planning
Always wait for the candle to close. A pin bar with ten minutes left can finish as a full-bodied breakout candle. After the close you have two broad options: enter immediately, or wait for confirmation — for example, a break of the pattern’s high for a bullish setup.
Example: EUR/USD falls into support at 1.0850 and prints a 4-hour hammer with a low of 1.0838, a high of 1.0872 and a close of 1.0868. A confirmation entry would be a buy stop a few pips above the high, at 1.0875, with a stop loss below the wick at 1.0830. The risk is 45 pips. For a 2:1 reward-to-risk ratio, the target needs to be 90 pips away at 1.0965. If resistance sits at 1.0910, the trade does not offer enough room and is better skipped.
Confirmation means a worse entry price and a wider stop, but it filters out patterns that fail immediately.
Common mistakes
- Trading every pattern you spot, regardless of location or trend.
- Ignoring the higher timeframe, such as buying a 15-minute bullish engulfing directly beneath daily resistance.
- Placing stops inside the wick rather than beyond it, where normal noise can reach them.
- Memorising dozens of exotic pattern names instead of understanding the handful above.
The common thread is the buyer-seller story behind each candle, which is the subject of the guide to price action trading.
No candlestick pattern works every time; each is one piece of evidence to be weighed alongside structure and trend. Forex and CFDs carry a high risk of loss, so keep position sizes small and only risk money you can afford to lose.
FAQ
Which candlestick pattern is the most reliable in forex?
There is no single most reliable pattern, and no pattern works on shape alone. Pin bars and engulfing candles are popular because they are easy to recognise and show clear rejection, but their usefulness depends on location, trend and timeframe. A modest pattern at a major level usually matters more than a perfect one mid-range.
What timeframe is best for candlestick patterns?
Higher timeframes such as the 4-hour and daily chart are generally more meaningful, because each candle summarises more trading activity and more traders see it. Patterns on 1- or 5-minute charts appear constantly and are heavily affected by noise and spread. Many traders find the level on a higher timeframe and the trigger on a lower one.
Should I wait for a candle to close before trading a pattern?
Yes. A candle can change shape completely in its final minutes, so a pattern does not exist until the period closes. After the close you can enter directly or wait for extra confirmation, such as a break of the pattern’s high or low. Confirmation costs some entry price but filters out immediate failures.