Is Gold an Inflation Hedge? What 50 Years of Data Say

Is Gold an Inflation Hedge?
Sometimes. In the 1970s gold rose more than 20-fold while inflation raged. Between 1980 and 1999 it lost about 70% in dollars while US prices doubled. Over decades gold has held its value; over the years you actually save or trade for, it can fail badly. It tracks real yields and inflation expectations, not last month's CPI.
That answer annoys both camps: the believers who say gold always protects you and the sceptics who say it never does. The record supports neither. Here it is, decade by decade.
What an Inflation Hedge Actually Means
A hedge is something that rises when the thing you fear happens. An inflation hedge should therefore rise when consumer prices rise, at roughly the same pace and at roughly the same time. Think of a wedding fund. You put money aside two years before the day. A true inflation hedge keeps that fund buying the same hall, the same food and the same photographer when the invitations go out, whatever prices have done in between.
That is a higher bar than gold went up a lot over fifty years. It has to go up when you need it to, not on average. Keep that test in mind for the three periods below.
The 1970s: The Decade Gold Earned Its Reputation
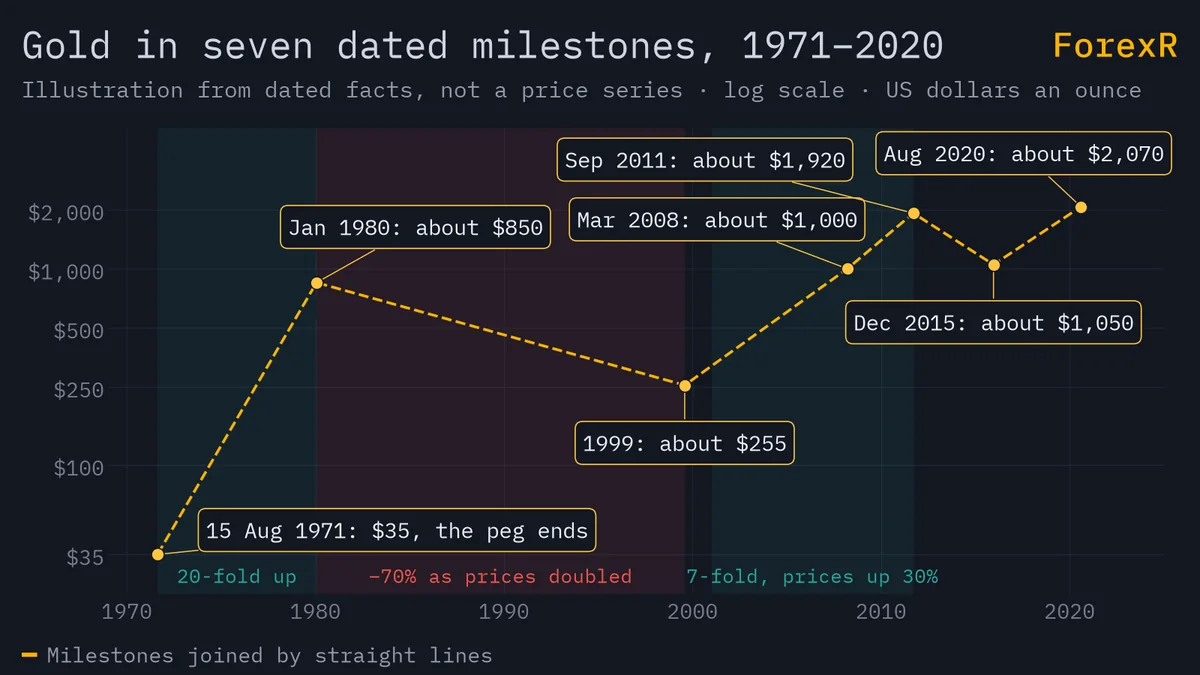
From 1934 gold was fixed at $35 an ounce. On 15 August 1971 Richard Nixon ended the dollar's convertibility into gold, and the decade that followed brought years of high inflation. Gold rose more than 20-fold, from $35 to a peak of about $850 in January 1980. Anyone who held it kept their wedding fund and then some.
Two caveats. Part of that rise was the release of a price held fixed since 1934, not inflation alone. And the peak arrived alongside the Iranian revolution and the Soviet invasion of Afghanistan, so fear did some of the lifting. Still: hedge test passed. Why gold has value tells the longer story of gold as money.
1980 to 2000: Gold Fell While Prices Doubled
Then came the period gold's admirers prefer to skip. From the January 1980 peak to the 1999 low of about $250-255, gold lost about 70% in dollar terms. Over the same twenty years US consumer prices roughly doubled. Do the arithmetic on paper: $850 to about $255 is 30 cents on the dollar; halve it again for the doubled price level and you have about 15 cents. Gold's buying power fell by more than 80%. A 1980 wedding fund kept in gold would have paid for less than a fifth of the same wedding in 1999.
What drove each of those swings is set out in gold price history and cycles.
Inflation never stopped in those years. It simply ran slower than interest rates, so the real yield on a bond was fat and positive, and gold had nothing to offer against it. The mood at the bottom is the surprising part. Between 1999 and 2002 the Bank of England sold about 395 tonnes of gold at an average price near $275, a decision later nicknamed Brown's Bottom after Chancellor Gordon Brown. Gold looked so useless as a hedge that a major central bank sold near the lowest price in two decades.
2001 to 2011: Up 7-Fold, but Not Because of CPI
From 2001 to the September 2011 record of about $1,920, gold rose about 7-fold while US consumer prices rose about 30%. Hedge test passed again, by a mile. But look at the causes. The first large US-listed gold ETF (an exchange-traded fund, which trades like a share) launched in 2004 and made gold as easy to buy as one. After 2008 central banks cut rates and added liquidity, real yields fell, and central banks themselves switched from net sellers to net buyers in 2010. Gold rose for the same reason it rose in the 1970s, cheap money and falling real yields, while consumer-price inflation in the rich world stayed modest. The hedge worked without much inflation to hedge.
What Gold Actually Tracks: Real Yields and Expectations
Put the three periods together and a pattern shows. Gold does not follow last month's consumer price index (CPI, the official basket of prices). It follows two things: real yields (a bond yield minus expected inflation) and expectations of where inflation is heading. Inflation helps gold only when it runs faster than interest rates, so that real yields fall or turn negative, as in the 1970s and after 2008. Inflation hurts gold when a central bank answers it with rates that rise faster than prices, as in the 1980s.
That is why a hot CPI print (a number above forecast) often pushes gold down on the day: traders expect the Fed to keep rates higher, yields jump, and the real yield rises. Gold and interest rates works through the yield side with numbers, and our fundamental analysis guide covers how to read the other releases.
Decades vs Years: The Honest Answer
What people get wrong is the time frame. The belief goes: gold protects you from inflation, so buy gold when inflation rises. Over fifty years it holds. From $35 in 1971 to a record above $2,000 in August 2020, gold rose more than 50-fold, far ahead of consumer prices. Over the years you actually save or trade for, it fails often. Twenty years is longer than most mortgages, and that is how long the 1980 buyer waited without protection.
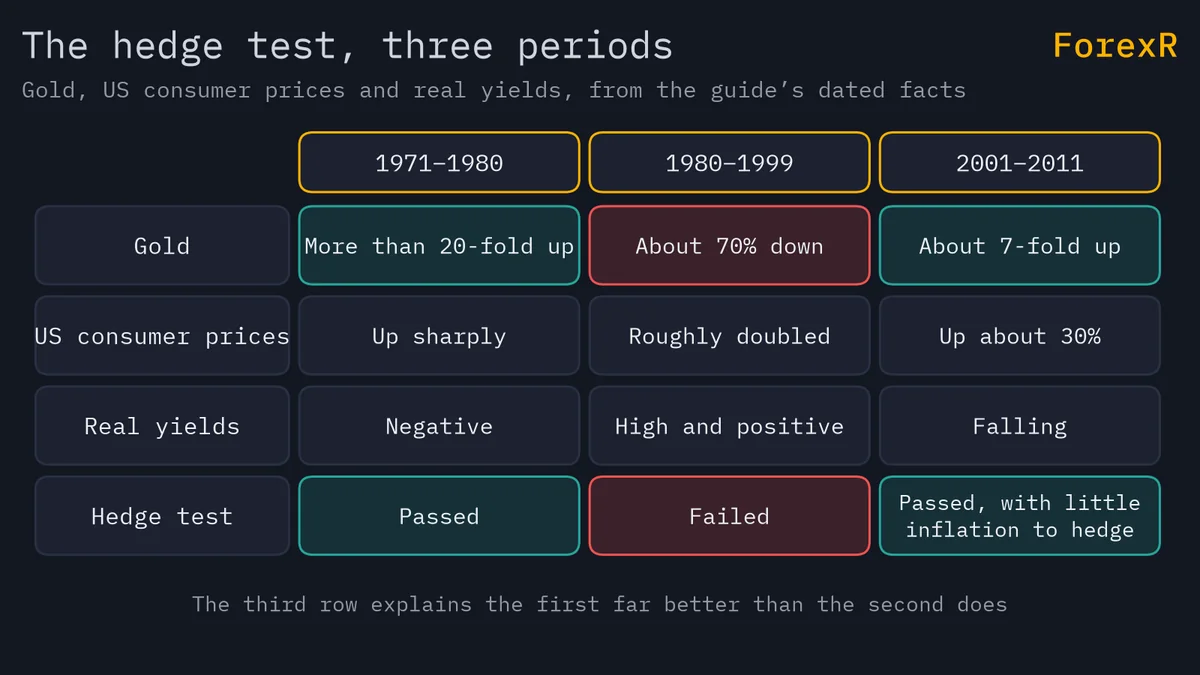
The honest answer: gold is a store of value across decades, a hedge against negative real yields and lost faith in money, and an unreliable hedge against the CPI over any span shorter than that. Gold vs bitcoin compares it with the other asset sold on the same promise.
What This Means for a Trader on CPI Day
A small-business owner in Ho Chi Minh City used to buy gold the moment a high inflation number flashed on her screen. US CPI lands at 8:30 a.m. New York, which is 7:30 p.m. in Hanoi during US summer time and 8:30 p.m. in winter. She kept getting stopped out in the first two minutes. Now she writes down the expected direction before the print, hot CPI means gold down, and waits fifteen minutes for the spike and retrace to finish before she does anything.
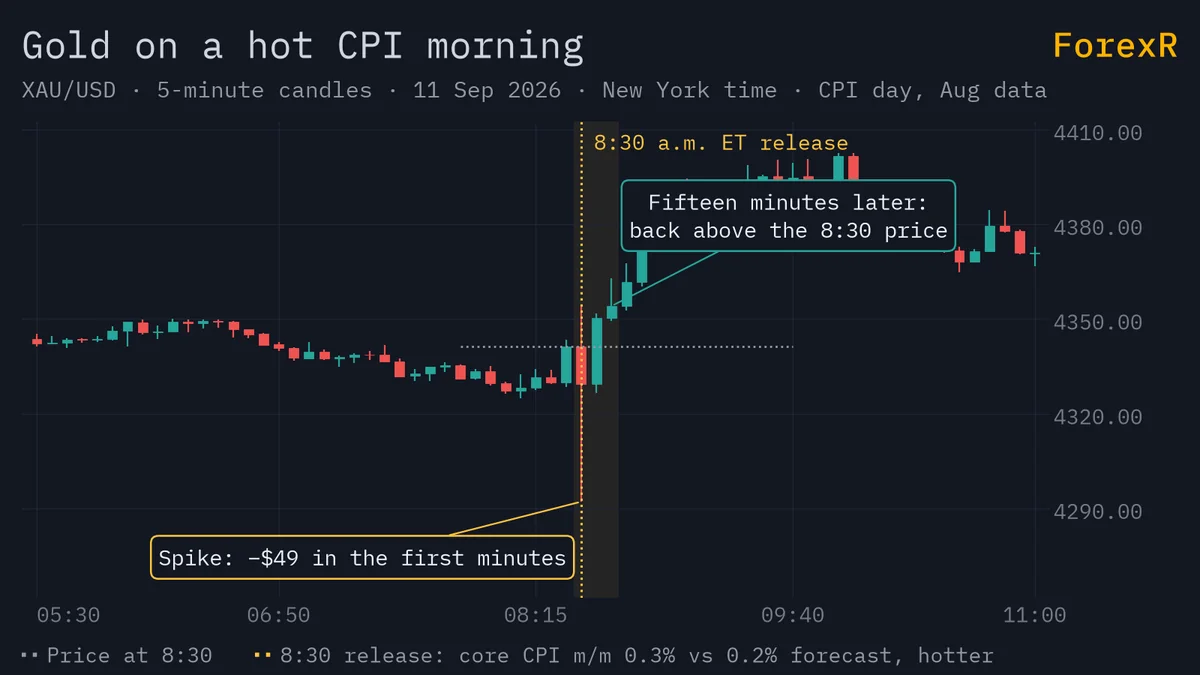
Size the day properly. At the example price of $3,000 an ounce (an example, not a forecast), a 1% move is $30 an ounce: $30 on a 0.01 lot, $300 on a 0.10 lot, $3,000 on a full lot. Spreads widen in the seconds around the release, so a stop inside that first spike is a donation. Our CPI guide explains the release, How to trade gold during news gives three ways to handle the first fifteen minutes, and the position size calculator turns a stop in dollars into a lot size. Gold spreads at news vary widely between brokers, which is one reason to compare regulated brokers on cost rather than on bonuses.
Try This: Test the Hedge on Paper
Take a sheet of paper and three lines: 1971 to 1980, 1980 to 1999, 2001 to 2011. For each, write gold's move from this guide (20-fold up, 70% down, 7-fold up) next to what consumer prices did (up sharply, doubled, up about 30%). Then write one word for what real yields were doing: negative, high, falling. The third column explains the first far better than the second does. Next CPI day, open the live gold page at the release and watch whether gold falls on a hot number. Ten minutes of watching teaches the lesson better than any chart.
Leveraged gold CFDs carry a high risk of loss; ESMA-era disclosures show 74-89% of retail CFD accounts lose money. Gold can fall hard and fast, including on the very inflation days it is supposed to protect against. Only risk money you can afford to lose.
FAQ
Is gold a good inflation hedge in Malaysia or India?
The same logic applies, with a twist. Gold in ringgit or rupees equals the dollar price times the exchange rate, so when a local currency weakens, local gold often rises even if XAU/USD is flat. That has made gold feel like a better inflation hedge in weaker-currency countries. It is really a currency hedge stacked on top of a gold position.
Should I buy gold when inflation is rising?
Not automatically. Gold has done best when inflation ran faster than interest rates, so real yields were negative, as in the 1970s. When a central bank raises rates quickly in response, real yields climb and gold can fall while prices are still rising. Ask what the central bank is doing about inflation, not just what the CPI number says.
How much has gold beaten inflation over the long term?
From $35 in 1971 to a record above $2,000 in August 2020 is a rise of more than 50-fold, well ahead of the rise in US consumer prices over the same period. Over that span gold clearly beat inflation. Inside it there was a twenty-year stretch when it lost most of its buying power, so the long-term average hides a lot of pain.
What is the difference between an inflation hedge and a store of value?
A store of value holds its worth over long periods. An inflation hedge rises when inflation rises, in step with it and at the time you need it. Gold is a reasonable store of value across decades but an unreliable inflation hedge across months or years, because its price answers to real yields and expectations rather than to the latest CPI print.