Gold Trading Strategies: 5 Setups to Test on XAU/USD

What Are the Best Gold Trading Strategies to Test?
At an example price of $3,000, an ordinary gold day travels $30 to $60, so a strategy must give price room. The five rule sets below fit gold's habits: it trends for weeks, pulls back to moving averages, respects $50 handles and jumps at US data. Each comes with an entry, stop, target, timeframe and the market that breaks it.
A strategy is a rule set you can write on one page and follow without thinking. None of the five is a promise: all five lose money in the wrong market, and the "when it fails" line is the most useful line in each.
First, the Sizing Rule Every Setup Shares
Risk 1% of the account per trade, and measure the stop in dollars, not pips. On gold a $1 move is $100 per standard lot, $10 per 0.10 lot and $1 per 0.01 lot, so lots = (account × 1%) ÷ (stop in dollars × 100). The position sizing guide covers the general method; here is the gold version.
- Account: $5,000, so 1% risk is $50.
- Example price: $3,000 an ounce (an example, not a forecast), daily ATR $30.
- Stop: 1.5 × ATR = $45 below the entry.
- Lots: $50 ÷ ($45 × 100) = 0.011, rounded down to 0.01 lot.
- Real risk: 0.01 lot × $45 = $45, or 0.9% of the account.
Think of the 1% as a rental deposit: you decide the most you can lose before you move in, not after the landlord keeps it. A $1,000 account with the same $45 stop cannot go below 0.01 lot, so it either accepts 4.5% risk or waits for a tighter setup. The position size calculator does the sum in seconds.
Strategy 1: Daily Trend, 4-Hour Pullback to the 20 EMA
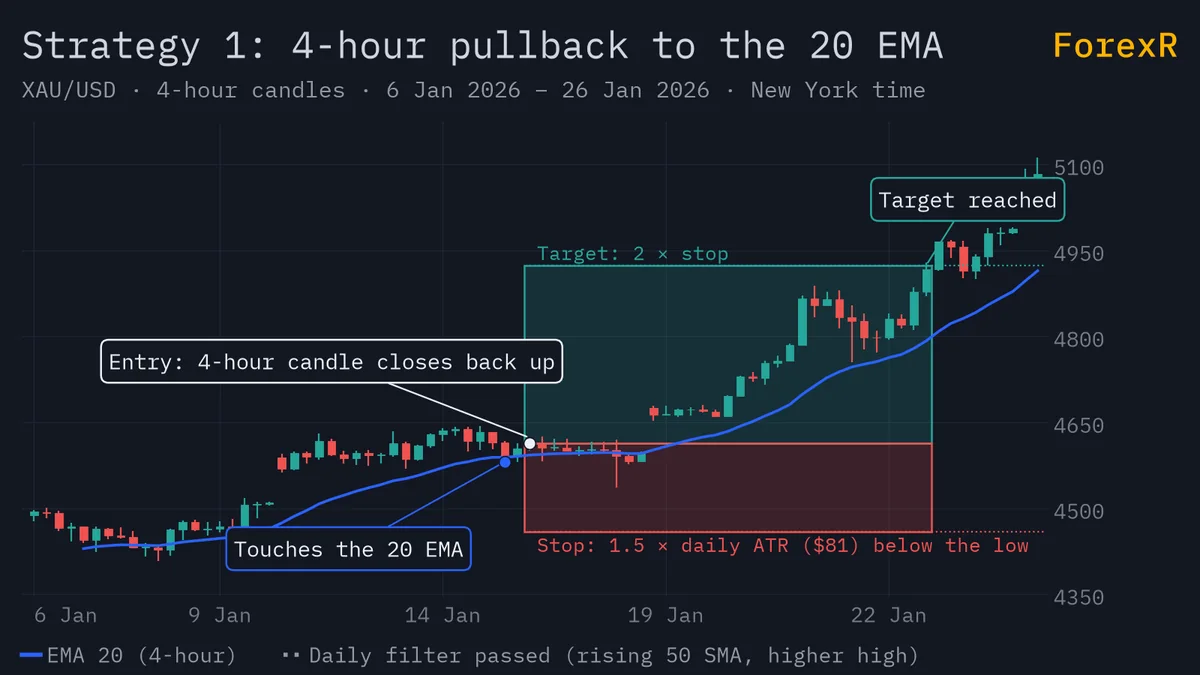
An EMA (exponential moving average) is an average price that gives recent candles more weight. This setup follows the daily trend and buys the dip on the 4-hour chart.
- Timeframe: daily for direction, 4-hour for entry.
- Filter: the daily close is above a rising 50 SMA and the last daily swing made a higher high.
- Entry: price touches the 4-hour 20 EMA and a 4-hour candle closes back in the trend direction.
- Stop: 1.5 × the daily ATR below the pullback low, $45 in our example.
- Target: twice the stop distance, or the prior swing high, whichever comes first.
- When it fails: sideways months. Price crosses the 20 EMA a dozen times, every touch is an entry and every entry is a small loss. Trends also end, and the setup gives back a chunk on the first real reversal.
Strategy 2: Asian Range Breakout at the London Open
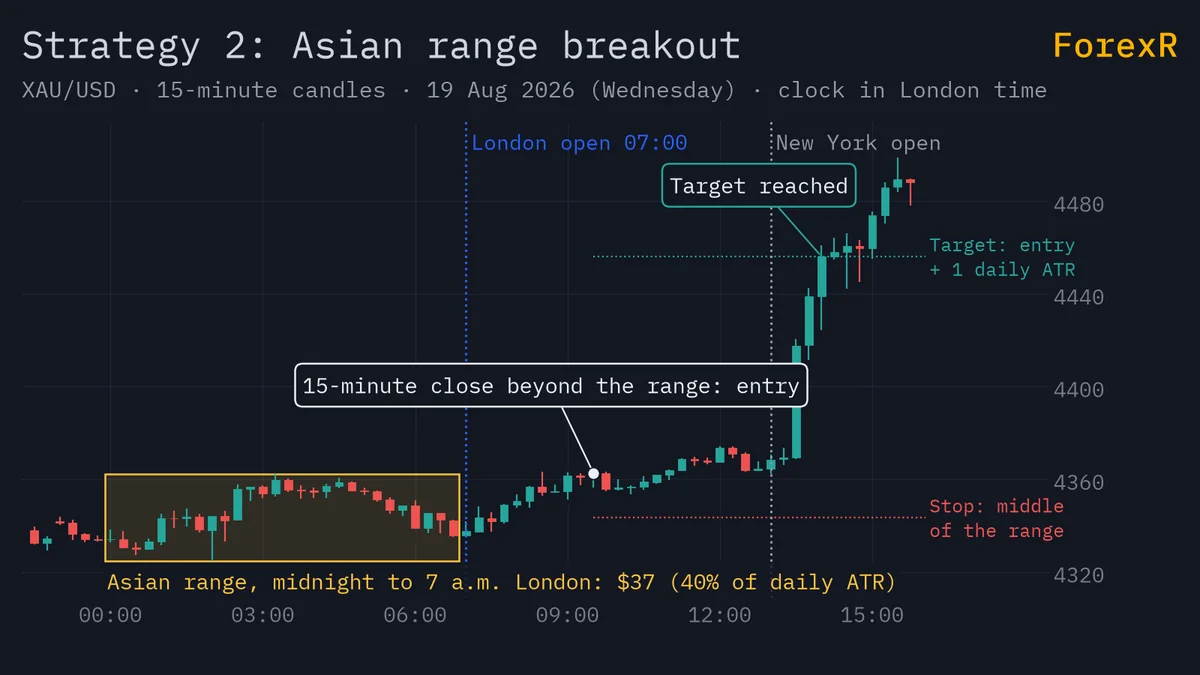
Asian hours are usually gold's quietest, and London often breaks the box they leave. The skill is not trading every box.
- Timeframe: 15-minute or 1-hour.
- Setup: mark the high and low from midnight to 7 a.m. London time. Skip the day if that range is wider than half the daily ATR, as the move may be spent.
- Entry: a 15-minute close beyond the range after 7 a.m. London.
- Stop: the middle of the Asian range.
- Target: one daily ATR from the breakout point, or exit at the New York open if nothing has happened.
- When it fails: fake breaks. London pushes through the high, hits the stops and reverses before New York. It also fails on CPI and NFP days, when the real move waits for 8:30 a.m. New York.
Breakout trading covers how to tell a clean break from a stop hunt, and the ATR guide covers the filter.
Strategy 3: New York Bounce From the Pivot or a $50 Handle
On ForexR's own three-month sample of hourly candles, gold's average hourly range was largest from 8 to 11 a.m. New York time, and the first push of that window is often faded. A pivot point is a level computed from yesterday's high, low and close.
- Timeframe: 5-minute or 15-minute, 8 to 11 a.m. New York only.
- Entry: price runs into the daily pivot or the nearest $50 handle, prints a rejection candle with a long wick, and the next candle closes back away from the level.
- Stop: $5 to $8 beyond the wick, never tighter than the 15-minute ATR.
- Target: the next pivot level, or half the daily ATR.
- When it fails: trend days. On a hot CPI morning the first touch of a handle does not hold; it gets sliced and the "bounce" becomes the stop. Sit out the first 15 minutes after any 8:30 a.m. release.
A shift nurse in Manila trades only this setup, three evenings a week, from 8 to 10 p.m. local time. She marks the pivot and the two nearest handles before her shift, sets alerts, and takes at most one trade. On CPI nights she does not open the platform. The pivot points guide shows the formula, and the live daily pivot for gold sits on the XAU/USD rates page.
Strategy 4: Swing Trade Off the Daily 50 SMA
- Timeframe: daily chart, holding for days to weeks.
- Entry: with the 50 SMA above the 200 SMA, wait for a daily close within one ATR of the 50 SMA, then buy the first daily close back above the previous day's high.
- Stop: 1.5 × daily ATR below the lowest low of the pullback.
- Target: the 20-day high, then trail the stop below each higher swing low.
- Cost: long gold usually pays swap nightly, with a triple night once a week, so price a three-week hold's financing in before entry.
- When it fails: regime change. On 12-15 April 2013 gold fell about 13% in two trading days, the largest two-day drop in about 30 years, and finished 2013 down about 28%. Fast markets fill stops at the next available price, not the price you chose.
Do Not: Grids and Martingale on Gold
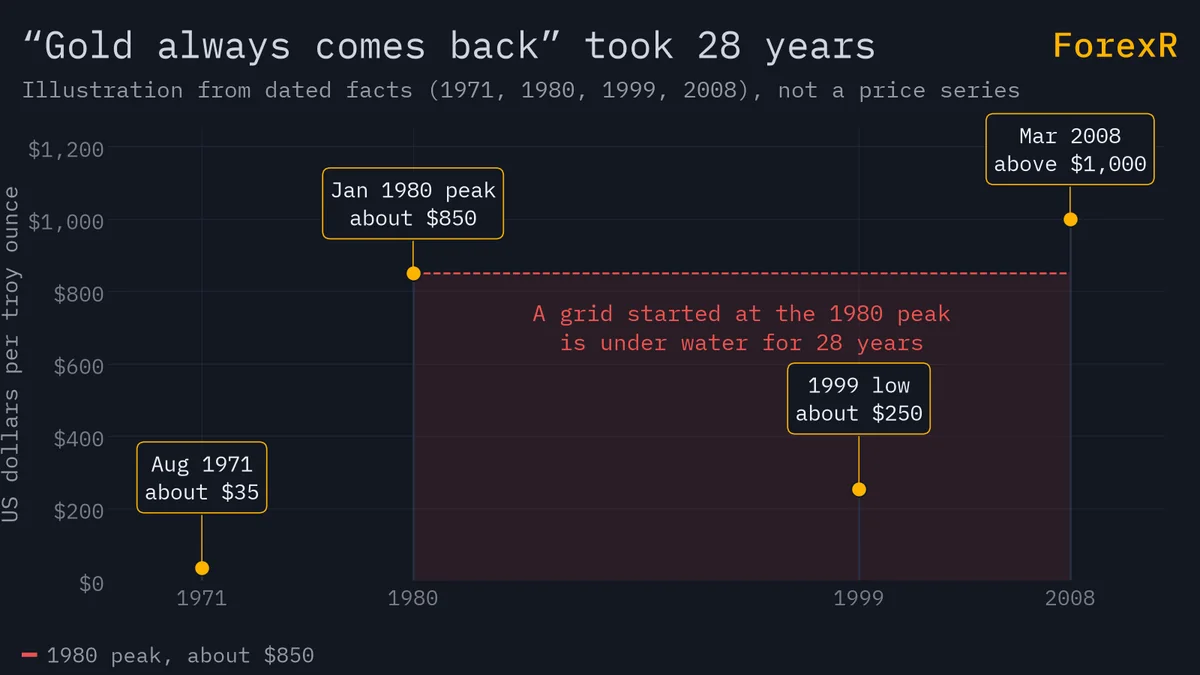
Grid trading opens new positions at fixed intervals as price moves against you; a martingale doubles the size after each loss. Both rest on one widely held belief: gold always comes back. History says otherwise: from its January 1980 peak of about $850, gold fell for about 20 years, lost about 70% in dollar terms and only beat that peak in 2008. A grid started in 1980 would have run out of margin decades before "back".
One thing not on this list is the calendar; gold seasonality explains why.
Gold's 1-2% daily range makes the maths worse: at $3,000 that is $30 to $60 against you on an ordinary day, and each grid level adds another 100 ounces per lot. The grid and martingale guide works through the arithmetic; the short version is that the account, not the strategy, is what gets tested.
Which Gold Strategy Suits Your Day?
Pick by clock, not by excitement.
- Full-time job, Asian time zone: Strategy 3 (8 to 11 p.m. in Kuala Lumpur, Singapore and Manila during US summer time) or Strategy 4 checked once a night.
- Free early mornings in Asia, or European hours: Strategy 2.
- Able to check charts every four hours: Strategy 1.
- Little time and small capital: Strategy 4 in 0.01 lots, or a demo until the sizing maths fits.
Whatever you choose, the levels are shared: handles, pivots, moving averages and the daily trend line. The gold technical analysis guide shows how to draw them top-down, and trend lines and channels covers the line itself.
How to Test a Gold Strategy Before Risking Money
Try this in five minutes. Open a demo XAU/USD chart on the 4-hour timeframe, scroll back three months and mark every touch of the 20 EMA while the daily 50 SMA was rising. For each, note whether a 1.5 ATR stop would have survived and whether twice the stop was reached. Twenty marks on paper tell you more than any thread of screenshots.
Then run it forward on demo for a month, one strategy only, with the sizing rule above. The faster setups are the most cost-sensitive, so compare gold spreads, commissions and swap on the broker comparison before going live. And remember the base rate: ESMA-era disclosures show 74-89% of retail CFD accounts lose money, and most of them had a strategy too.
Leveraged gold CFDs carry a high risk of loss. Gold can fall $100 in a session, gap over a weekend and blow through a stop at news; risk only money you can afford to lose.
FAQ
What is the simplest gold trading strategy for a beginner?
A once-a-day routine on the daily chart: trade only in the direction of the 50-day moving average, enter on a pullback that closes back above the previous day's high, place the stop 1.5 daily ATR below the pullback low and risk 1% or less. One check a night, one trade at a time, tested on a demo first.
How many pips should a gold stop loss be?
Think in dollars, not pips, because brokers define a gold pip differently. A sensible swing stop is 1 to 1.5 times the daily ATR; a day-trade stop is at least the ATR of the timeframe you trade. Since a $1 move is $100 per lot, convert the stop to dollars and size the position from it.
Can I use forex strategies on gold?
Mostly yes, with two changes. Gold's volatility has typically been about double EUR/USD's, so stops must be wider in percentage terms and lot sizes smaller. Gold also reacts hardest to US data at 8:30 a.m. and 2 p.m. New York, so a strategy that ignores the calendar will be stopped at the worst moments.
Is gold better for swing trading or day trading?
Both are workable, with different costs. Swing trades pay swap every night, usually on the long side, with a triple night once a week, so financing matters over weeks. Day trades avoid swap but pay the spread more often and depend on the 8 to 11 a.m. New York window for movement. Pick the one your clock allows.