MACD Indicator Explained: Settings, Signals & Divergence

What is the MACD indicator?
MACD (Moving Average Convergence Divergence) is a momentum and trend-following indicator that measures the distance between two exponential moving averages of price. When the faster average pulls away from the slower one, momentum is building; when they converge, momentum is fading. Traders read it through three elements — the MACD line, the signal line and the histogram — to judge trend direction, momentum and possible turning points.
MACD was developed by Gerald Appel in the late 1970s, and the histogram was added by Thomas Aspray in 1986. It is built entirely from moving averages, so if EMAs are new to you, read that guide first.
How MACD is calculated
The standard settings are 12, 26 and 9, and they produce three outputs:
- MACD line = 12-period EMA − 26-period EMA.
- Signal line = 9-period EMA of the MACD line.
- Histogram = MACD line − signal line.
A quick example: if the 12-period EMA on EUR/USD is 1.0862 and the 26-period EMA is 1.0841, the MACD line is 1.0862 − 1.0841 = 0.0021, or 21 pips. If the signal line is at 0.0015, the histogram reads 0.0021 − 0.0015 = 0.0006. Note that MACD is expressed in price units and has no upper or lower limit. A reading of 0.0021 on EUR/USD and 0.21 on USD/JPY both describe a 21-pip gap, so you cannot compare raw values across pairs, and there are no fixed overbought or oversold levels.
Signal-line crossovers
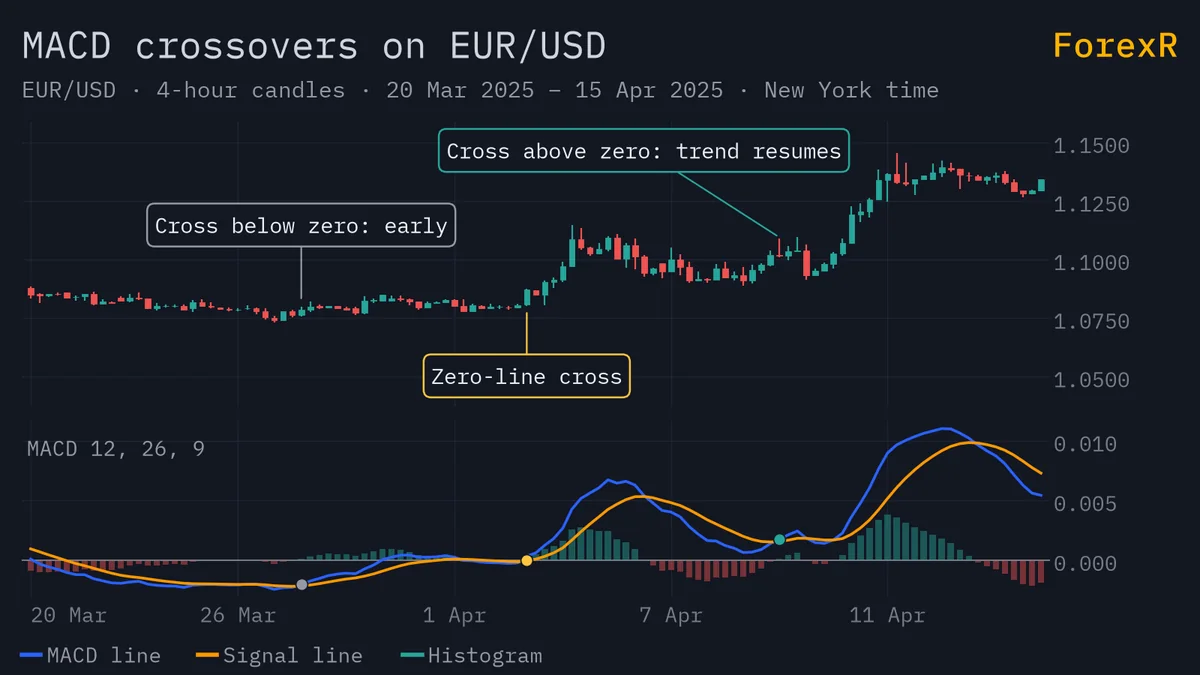
The most widely used signal is the MACD line crossing the signal line. A cross above suggests short-term momentum is turning up; a cross below suggests it is turning down. These crossovers happen often, so context matters. A bullish crossover that occurs below zero after a long decline is an early, riskier signal, while one that occurs above zero in an established uptrend is a prompt to rejoin the trend after a pullback. Many traders ignore crossovers against the prevailing trend altogether.
Zero-line crossovers
The MACD line crosses zero at exactly the moment the 12-period EMA crosses the 26-period EMA — it is the same event drawn differently. Above zero, the faster average is above the slower one and the bias is bullish; below zero, the bias is bearish. Zero-line crossovers are slower than signal-line crossovers but less frequent, which makes them more useful as a trend filter than as an entry trigger. A simple rule some traders use: only take long signals while MACD is above zero and only short signals while it is below.
Reading the histogram
The histogram shows the gap between the MACD line and its signal line, so it reacts first. Bars growing taller mean momentum is accelerating in that direction; bars shrinking towards zero mean momentum is slowing, even if price is still making progress. The histogram crosses zero whenever the two lines cross. A shrinking histogram is a warning to pay attention, not an automatic reason to reverse — trends often pause and then resume.
Bullish and bearish divergence
Divergence is a disagreement between price and the indicator:
- Bullish divergence: price makes a lower low, but MACD (or its histogram) makes a higher low. Selling pressure is weakening.
- Bearish divergence: price makes a higher high, but MACD makes a lower high. Buying pressure is weakening.
Divergence tells you momentum is fading; it does not tell you when price will turn. In a strong trend, divergence can build across several swings while price keeps going. Treat it as an alert and wait for confirmation from price itself — a break of a trend line or swing point, or a clear reversal candle as described in price action trading.
Why MACD lags and whipsaws in ranges
Everything in MACD is an average of past prices, and the signal line is an average of an average. By the time a crossover appears, part of the move has already happened. That is the cost of smoothing, and it is acceptable when trends run long enough to pay for the late entry.
In a sideways market the cost is not repaid. The two EMAs twist around each other, the MACD line hovers near zero and crossovers fire in both directions, each one often followed by a small loss. If MACD is flat and hugging the zero line, the message is that there is no trend to follow, and a crossover system is the wrong tool for the moment.
Combining MACD with trend and support/resistance
MACD works best as one input among several rather than as a stand-alone system. A practical routine looks like this:
- Set the bias on a higher timeframe — for example the daily trend — and take MACD signals on the 1-hour or 4-hour chart only in that direction.
- Give more weight to crossovers and divergences that appear at a meaningful level rather than in the middle of nowhere.
- Place your stop beyond the recent swing, not at an arbitrary distance, and size the position so the loss is a small, fixed fraction of your account.
The first step is covered in multi-timeframe analysis, and mapping support and resistance beforehand gives the signals a location. The EMA trend grid on the free live dashboard shows at a glance whether the 5-minute, 1-hour, 4-hour and daily trends agree, which is a quick way to filter out counter-trend crossovers. Position size and stop placement are covered in risk management.
Settings myths and MACD vs RSI
There are no secret settings. Shorter inputs make MACD faster and noisier; longer inputs make it smoother and slower. Every choice trades speed against false signals, and settings tuned to fit last year’s chart perfectly usually disappoint on new data. The 12, 26, 9 default is a reasonable starting point on any timeframe. If you change it, do so for a reason and test the result over a large sample, as explained in backtesting and journalling.
MACD and the RSI indicator both measure momentum, but in different ways. RSI is bounded between 0 and 100, so it offers overbought and oversold reference levels and tends to be more useful in ranges. MACD is unbounded and built from moving averages, so it is better at describing trend direction and strength. Some traders use both — MACD for the trend, RSI for timing pullbacks — but remember they are derived from the same price data, so agreement between them is not independent confirmation.
No indicator removes risk. Forex and CFDs carry a high risk of loss, and leverage can magnify losses quickly — only risk money you can afford to lose.
FAQ
What are the best MACD settings for forex?
There are no universally best settings. The standard 12, 26, 9 is a sensible default on any timeframe. Shorter inputs react faster but give more false signals; longer inputs are smoother but later. If you change them, test the new settings over a large sample rather than fitting them to a recent chart.
Is MACD a leading or lagging indicator?
MACD is a lagging indicator because it is built from exponential moving averages of past prices, and the signal line is an average of that again. Crossovers therefore appear after a move has begun. Divergence and a shrinking histogram can give earlier warnings, but they need confirmation from price before you act.
What does a MACD zero-line crossover mean?
The MACD line crosses zero when the 12-period EMA crosses the 26-period EMA. Above zero, the faster average is above the slower one and the trend bias is bullish; below zero it is bearish. It is slower than a signal-line crossover, so many traders use it as a trend filter rather than an entry trigger.
Is MACD better than RSI?
Neither is better; they do different jobs. MACD is unbounded and built from moving averages, so it describes trend direction and momentum well. RSI is bounded between 0 and 100, giving overbought and oversold reference levels that are handy in ranges. Both come from the same price data, so agreement is not independent confirmation.