Gold-Silver Ratio Explained: How to Read and Trade It

What Is the Gold-Silver Ratio?
One ounce of gold buys how many ounces of silver? That number is the gold-silver ratio. Divide the gold price by the silver price. At an example gold price of $3,000 and an example ratio of 75, silver would be $40. A high ratio means silver is cheap against gold; a low ratio means silver is dear.
Think of it as a price in a different currency. Instead of asking what gold costs in dollars, you ask what it costs in silver, the way a market trader might say a chicken costs three kilos of rice. The dollar drops out, leaving the relationship between the two metals. The silver trading guide has a short section on the ratio; this one goes deeper.
A Short History of the Ratio: 15, 47, 65 and 125
The ratio was once set by law: the US Coinage Act of 1792 fixed it at 15:1, because the mint struck both metals as coins and needed a legal rate between them. Once silver stopped being money the ratio drifted: about 47 on average across the 20th century, about 65-70 since 2000.
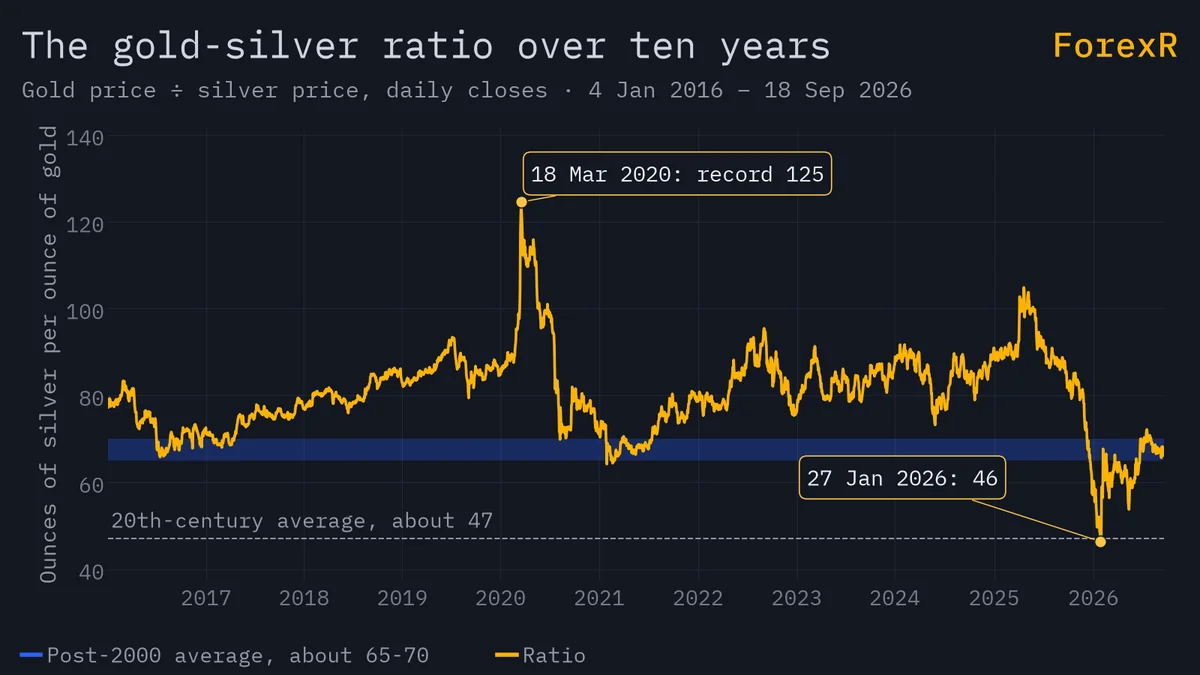
Extremes are the memorable part. In January 1980, as gold peaked at about $850, the ratio dropped to about 17 because silver had risen even faster. In April 2011 it fell to about 32. Then in the March 2020 crash it set a record of about 125: silver was sold harder than gold because half its demand is industrial and factories were shutting. From 17 to 125 is a seven-fold swing.
Why Does Silver Move More Than Gold?
- Size: the silver market is far smaller than gold’s, so the same buying or selling moves the price further; a large fund rebalancing is a ripple in gold and a wave in silver.
- Industrial demand: about half of silver demand comes from electronics, solar panels and other industry. When the economy slows that demand falls, a business-cycle risk gold mostly lacks.
The result shows up in volatility. Gold’s annualised volatility has typically been about 15%; silver’s about double that. So in a rally silver usually rises more and the ratio falls; in a sell-off silver falls more and the ratio rises. The ratio is, in effect, a volatility gauge for the pair. The gold correlations guide puts the +0.7 to +0.9 gold-silver correlation beside gold’s other relationships.
How Traders Read Ratio Extremes
A trader reading the ratio asks one question: is silver unusually cheap or dear against gold, compared with the post-2000 average of about 65-70? Far above that band, silver is cheap relative to gold; far below, it is dear. Relative matters: a high ratio can mean cheap silver or expensive gold, and the trade depends on which.
Three ways traders use that reading:
- As a choice between metals: long precious metals with the ratio very high, silver offers the bigger move if the ratio normalises; with the ratio very low, gold is the calmer choice.
- As a mood gauge: a falling ratio during a rally means silver is leading and speculators are confident; a rising ratio during a rally means gold is leading and fear is doing the buying.
- As a spread trade: long one metal, short the other, betting on the ratio rather than either price: the ratio trade.
Whichever way you use it, read the ratio beside the live pages for gold and silver, because a ratio alone hides which metal is doing the moving.
The Ratio Trade With CFDs: A Worked Example
Suppose gold is at the example price of $3,000 an ounce (an example, not a forecast) and the ratio is 100, so silver is $30. You expect the ratio to fall, so you buy silver and sell gold in equal dollar amounts.
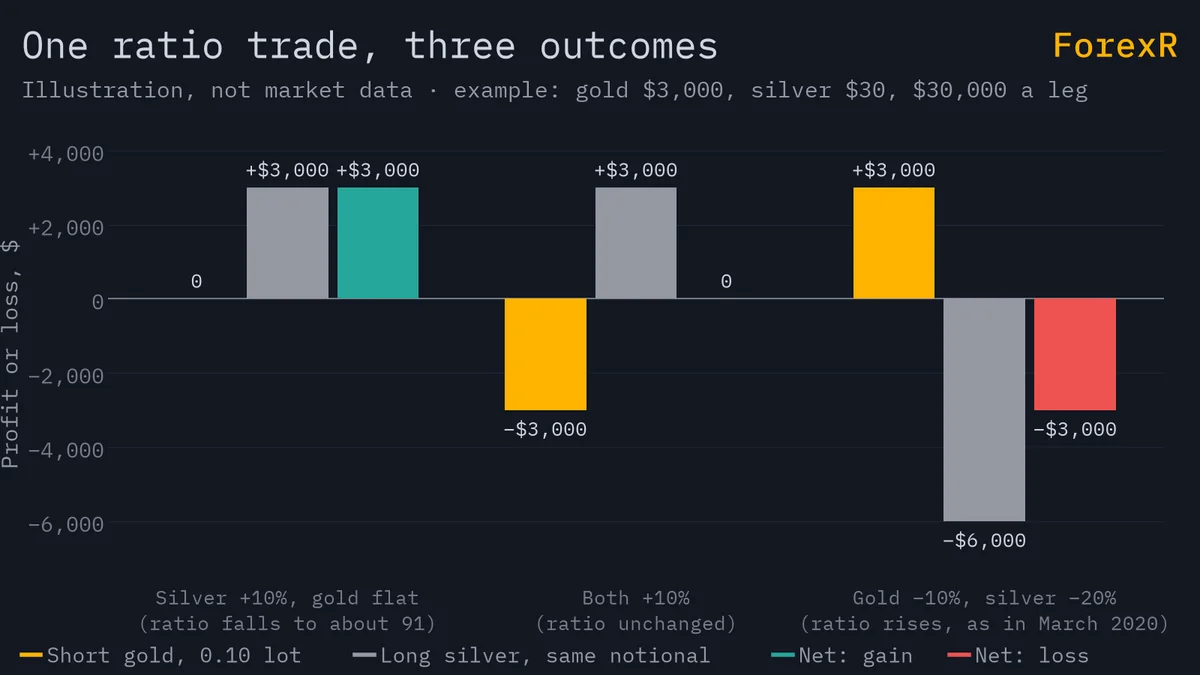
Equal dollar amounts is the key phrase. A 0.10 lot of gold is 10 ounces, so $30,000 of notional, the full value of the position. Open a silver CFD (a contract that tracks the price without owning metal) with the same $30,000 of notional; check your broker’s silver contract size, because it is not gold’s 100 ounces. The margin calculator shows what each leg locks up.
Now play it forward on paper:
- Ratio falls, gold flat: silver rises 10% to $33 while gold stays at $3,000, so the ratio is about 91. The silver leg gains about $3,000 (10% of $30,000); the gold leg is flat. Net about +$3,000 before costs.
- Both rise the same: gold up 10%, silver up 10%. The short gold leg loses $3,000, the long silver leg gains $3,000. Net zero, minus costs: the ratio did not move.
- Crash, silver falls harder: gold down 10%, silver down 20%, as in March 2020. The short gold leg gains $3,000 and the long silver leg loses twice that. Net about −$3,000, even though you were “hedged”.
Remember the third line. A ratio trade removes gold’s direction from your result but not the risk: it concentrates it in the ratio, which can spike exactly when markets panic.
What a Ratio Trade Costs to Hold
Two legs means two sets of costs, running every night.
- Two spreads: the gold spread and the silver spread, paid to get in and again to get out. Silver’s is usually wider in percentage terms.
- Two swaps: swap is the overnight financing charge. Long silver usually pays it; short gold may receive a little or may also pay, depending on the broker. Both are charged at 5 p.m. New York, and one weekday a week carries a triple swap to cover the weekend.
- Two margins: the broker does not net a gold short against a silver long, so margin is locked on both.
Put numbers on it. If the combined swap on the two legs is −$5 a night per $30,000 pair (an example, not any broker’s rate), 60 trading nights including 12 triple nights is 84 charges, about $420, before spreads. A ratio move that takes three months to arrive must beat that first. The gold spread and swap guide shows how to read both lines in the contract specification.
Why the Ratio Can Stay Extreme for Years
What people get wrong: “the ratio always returns to its average, so an extreme is a sure trade.” Stated fairly, the belief rests on real history: the extremes of 1980, 2011 and 2020 did all reverse. But which average? The 1792 level of 15 never came back, and the 20th-century average of about 47 gave way to a post-2000 average of about 65-70. Anyone who sold silver against gold in the 1990s waiting for 15, or bought it in the 2010s waiting for 47, waited a very long time.
Averages move because demand moves: industry finds new uses for silver, while central banks buy gold and not silver. Mean reversion in the ratio is real but slow and unreliable, and a leveraged CFD pays financing every night while it waits. That is why the ratio trade suits patient, well-funded traders and punishes small accounts, a point the position sizing guide makes in numbers.
Try This: Chart the Ratio in Five Minutes
A schoolteacher in Bandung checks both metals over breakfast. Once a week she writes the gold price, the silver price and the ratio in the back of her planner. She has no position most of the time; the ratio simply tells her which metal to study when she wants one. After a year, that column of numbers has taught her more about “extreme” than any article.
Your version, in MT5 or on paper: note gold’s and silver’s closing prices each Friday, divide, and plot the result with the post-2000 band of about 65-70 marked. After a few weeks you will see whether the ratio is drifting towards silver or gold, and which metal is doing the moving. To try the trade itself, use a demo account first and compare how two brokers quote silver’s spread and swap on the broker comparison; the gap between them can be most of a ratio trade’s edge.
The risk in plain words: a ratio trade is two leveraged metal CFDs, not a shelter from loss. Both metals can fall hard and fast, silver faster than gold, and the ratio can widen for years while financing costs tick over nightly. Leveraged gold and silver CFDs carry a high risk of loss. Only risk money you can afford to lose.
FAQ
What is a good gold-silver ratio to buy silver?
There is no fixed number. Traders compare the current ratio with the post-2000 average of about 65-70 and treat readings far above it as silver being cheap relative to gold. Relative is the catch: the ratio hit about 125 in March 2020 and silver was still falling. A high ratio is a reason to study silver, not a signal on its own.
Can I trade the gold-silver ratio directly?
Most retail CFD brokers do not offer the ratio as a single instrument, so you build it from two positions: long one metal and short the other in equal dollar amounts. That means two spreads, two overnight swaps and two margin requirements. Some futures exchanges list spread contracts, but those are for larger, professional accounts.
Why was the gold-silver ratio fixed at 15 to 1?
The US Coinage Act of 1792 set 15 ounces of silver equal to one ounce of gold because both metals circulated as coins and the mint needed a legal exchange rate between them. It was a coinage rule, not a market price. Once silver stopped serving as money, the market ratio drifted far above 15 and never returned.
Does a high gold-silver ratio mean a recession is coming?
Not reliably. The ratio tends to rise in fear because about half of silver demand is industrial, so silver falls faster than gold when factories slow, as in March 2020. But it also rises for reasons unrelated to growth, such as central bank gold buying. Treat a rising ratio as a sign of caution in metals, not as an economic forecast.