How to Trade Gold During News: NFP, CPI and Fed Days

How Do You Trade Gold During News Releases?
Treat a gold news release like a wedding buffet opening: the first minute is elbows and spilled plates, and the sensible guests wait. In practice that means knowing which release is due, deciding before 8:30 a.m. New York whether you stand aside, trade the retrace or hold with a wider stop, and never clicking in the first spike.
A release is a scheduled economic number. Gold reacts to US releases most, because it is priced in dollars and its main driver is the US real yield, the bond yield minus expected inflation. The general playbook is in trading the news; this guide covers what changes on gold.
Which News Releases Move Gold Most?
- FOMC decisions (2 p.m. New York, press conference 30 minutes later): the biggest, because they set the rate path directly. The FOMC guide has the mechanics.
- CPI (monthly, 8:30 a.m. New York): the inflation print that moves rate expectations fastest. The CPI guide explains headline versus core.
- NFP (monthly, 8:30 a.m. New York): jobs and wages, which feed the Fed's thinking. The NFP guide covers the report itself.
- PCE (monthly, 8:30 a.m. New York): the Fed's preferred inflation measure, usually quieter because CPI arrives first.
- Second tier: retail sales, ISM surveys, jobless claims and Fed speakers, each able to move gold on a slow day.
Check the week ahead on the economic calendar every Sunday; a gold trader who does not know CPI is tomorrow is guessing with a wider spread.
Hot Data, Higher Yields, Weaker Gold: The Usual Logic
Here is what people get wrong. "Inflation is hot, gold is an inflation hedge, so buy gold on a hot CPI." Fairly stated, gold did rise more than 20-fold from 1971 to 1980 while inflation raged. On the day, though, the chain runs the other way: a hot print raises expected Fed rates, bond yields rise, the real yield rises, and gold, which pays nothing, falls. So a hot CPI often pushes gold down within seconds.
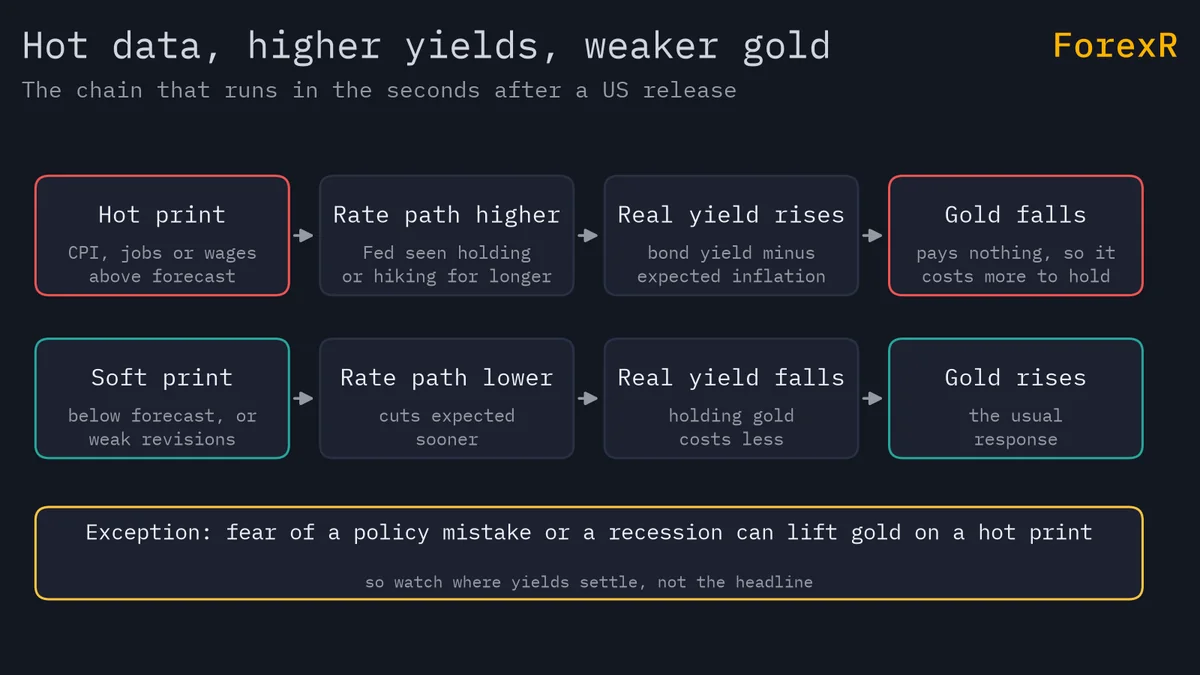
- Hot data (higher CPI, more jobs, faster wages): yields up, dollar up, gold usually down.
- Soft data: yields down, dollar down, gold usually up.
- Fed decision: the surprise relative to expectations matters, not the decision itself. A cut described as "less dovish than hoped" can sink gold.
- The exception: when data raises fear of a policy mistake or a recession, gold can rise on hot data too. Watch yields, not the headline.
For the full mechanism read gold and interest rates, and for the long-run answer on the hedge question read is gold an inflation hedge.
The First 15 Minutes: Spike, Retrace, Real Move
The pattern repeats often enough to plan around, never reliably enough to bet on blind.
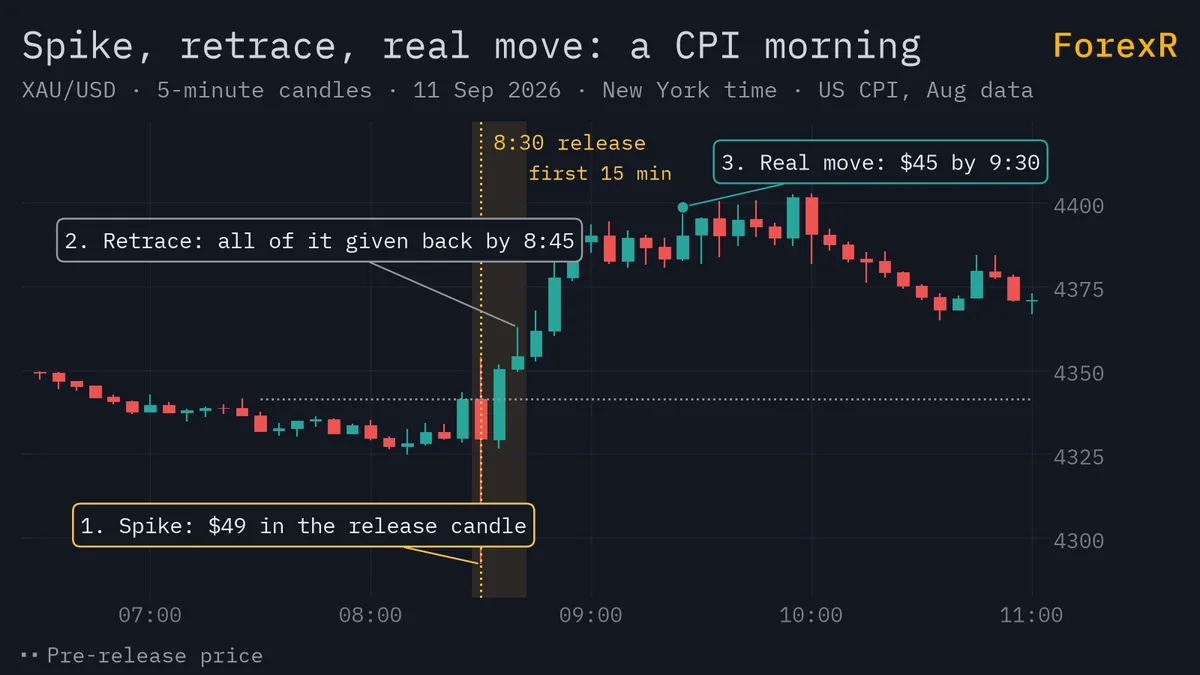
- Seconds 0 to 60: the spike. Algorithms read the headline and gold jumps, say $10 to $30 at an example price of $3,000. The spread is at its widest.
- Minutes 1 to 15: the retrace. Humans read the revisions and the core number, and price often gives back half the spike or more.
- Minutes 15 to 60: the real move. Once yields settle, gold picks a direction, and the 8 to 11 a.m. New York window, the busiest of the day on ForexR's own hourly sample, carries it.
None of this means "fade the spike". The first candle is simply the least informative and most expensive of the morning; a 5-minute close after the retrace tells you which way yields actually went.
Spreads and Slippage at the Release
Spreads widen in the seconds around US data, and slippage, the gap between the price you asked for and the one you got, does the rest. Round numbers at the $3,000 example price:
- Normal spread: $0.30, which costs $3 per round trip on 0.10 lot.
- Release spread: suppose it jumps to $2 for ten seconds. That is $20 on 0.10 lot before price has moved.
- Stop slippage: your stop is $20 below entry, the print gaps through it and fills $8 lower. Planned loss on 0.10 lot: $200. Actual loss: $280.
- Pending orders: a buy stop placed to "catch the spike" fills at the top of it, on the wide spread, then meets the retrace.
Slippage is a car deposit that turns out larger than the sticker said: you agreed to one risk and paid another. Execution at news is worth comparing on the broker comparison before you learn it the expensive way.
Three Ways to Handle a Gold News Event
- Stand aside. Flat 15 minutes before and after. Boring, and for most traders the best answer: you keep your capital and trade the real move on a normal spread.
- Trade the retrace. Wait for the first 5-minute candle that closes against the spike, enter in the direction yields have settled, stop beyond the spike extreme, target the pre-release price or the next pivot. When it fails: a trend release, where the spike simply continues.
- Hold a pre-existing position with a wider stop. Only if the trade was built on the daily chart and the stop was already outside the noise. Worked example: $5,000 account, 1% risk, 0.02 lot with a $25 stop ($50 risk). Before CPI, widen the stop to $50 and cut the size to 0.01 lot. Risk stays $50, and the position now survives a $40 spike. Or keep 0.02 lot and accept $100, 2% of the account, with your eyes open.
Decide before 8:29 a.m. New York and write it down; decisions made at 8:30 and five seconds are not decisions.
The Local Release Clock for Gold Traders
An accountant in Kuala Lumpur who swing-trades gold sets one alarm on CPI evenings: 8:20 p.m. She closes the chart, reads the print on her phone at 8:30, and opens the 5-minute chart at 8:45 with a cup of tea.
- NFP and CPI, 8:30 a.m. New York: 12:30 UTC in US summer, 13:30 UTC in winter. Kuala Lumpur, Singapore and Manila 8:30 p.m. summer, 9:30 p.m. winter; Jakarta, Bangkok and Hanoi one hour earlier; Mumbai 6 p.m. summer, 7 p.m. winter.
- FOMC decision, 2 p.m. New York: 18:00 UTC summer, 19:00 winter. Kuala Lumpur 2 a.m. summer, 3 a.m. winter, press conference 30 minutes later. Asian traders either stay up or leave no position sized for a normal night.
The market hours tool converts any release to your clock, and the best time to trade gold guide maps the whole gold day in local time.
Monthly Central Bank Reserve Updates
Not all gold news lands at 8:30. Central banks have been net buyers of gold every year since 2010, after about two decades as net sellers, and in 2022 they bought about 1,080 tonnes, the most on record, then more than 1,000 tonnes again in 2023. That demand shows up in monthly reserve reports. The People's Bank of China reports its reserves, including gold, monthly, usually around the 7th, and a pause or resumption in its buying can move gold in thin Asian hours.
Slower news, then: it rarely spikes price the way CPI does, but it sets the tone for weeks.
A Gold News-Day Preparation Checklist
- Sunday: mark every red-flag US release for the week, in your local time.
- The night before: note the consensus number and what "hot" and "soft" would mean for yields.
- One hour before: decide stand aside, retrace or hold; write down stop and size.
- Fifteen minutes before: cancel pending orders near the market; they are spike bait.
- At the release: read the number, the revision and the core figure. Do not click.
- Fifteen minutes after: check the spread is normal and where yields settled, then trade the plan or close the platform.
Try this on the next CPI evening, on a demo: keep the live XAU/USD page open beside your platform's 1-minute chart and write down the spread and the price at 8:29, 8:30, 8:35 and 8:45 New York time. One evening of notes will teach you more about the first 15 minutes than this page can.
Leveraged gold CFDs carry a high risk of loss, and news minutes are when that risk peaks: spreads widen, stops slip and a $30 spike against an oversized position can end an account. Gold can fall hard and fast on a headline; trade the plan, not the number, and risk only money you can afford to lose.
FAQ
Should I close my gold trade before NFP?
Close it if the stop is inside the normal news range, roughly $10 to $30 at the example price of $3,000, or if the trade was a short-term one. A daily-chart swing trade with a stop already beyond the noise can be held, but only at a size where a fast fill $10 past the stop is still an acceptable loss.
Can I trade gold during the FOMC press conference?
You can, and it is harder than the decision itself, because the press conference runs about an hour and gold can reverse on a single sentence. Spreads are wider throughout. If you trade it at all, wait for the 5-minute chart to settle after the first questions and use the same stop rules as any other news event.
How long does gold stay volatile after a news release?
Typically the spread normalises within a few minutes, the spike-and-retrace plays out inside about 15 minutes, and the direction chosen after that often carries through the 8 to 11 a.m. New York window. On FOMC days the volatility can last into the close, because the press conference adds a second round.
Does gold react to non-US news?
Yes, but less predictably and less on schedule. European Central Bank and Bank of Japan decisions move gold through the dollar, geopolitical headlines move it through fear, and central bank reserve reports move it through demand. None of these has the tight 8:30 a.m. New York routine of US data, so they are harder to plan around.