Gold Technical Analysis: Levels, ATR and Round Numbers

How Does Technical Analysis Work on Gold (XAU/USD)?
Gold draws some of the cleanest levels on your platform. It respects $50 and $100 handles, leans on the 50- and 200-day averages and trends for weeks, then spikes through everything at 8:30 a.m. New York. Technical analysis on gold means reading those levels with a ruler, and the ruler is the daily ATR. Here is the routine.
Technical analysis means using past prices to decide where to enter, where to exit and where you are wrong. A level is any price where the market turned before; a handle is a round price such as $3,000. You often hear that gold is "too news-driven" for charts. Fairly stated, US data does move gold more than most pairs. The record still favours levels: the January 1980 peak of about $850 stood as a ceiling for 28 years, until 2008. Levels do not get more stubborn than that. Support and resistance covers the general idea; this one is gold-specific.
Why Gold Respects Round Numbers
Traders, dealers and option desks put orders at round prices because they are easy to agree on, so $50 and $100 handles become crowded, and crowds make levels. March 2008 is the classic case: gold touched about $1,000 for the first time, was rejected, and fell about 30% to about $700 by November before setting new records in 2009-2011. The first touch of a big handle is often the hardest.
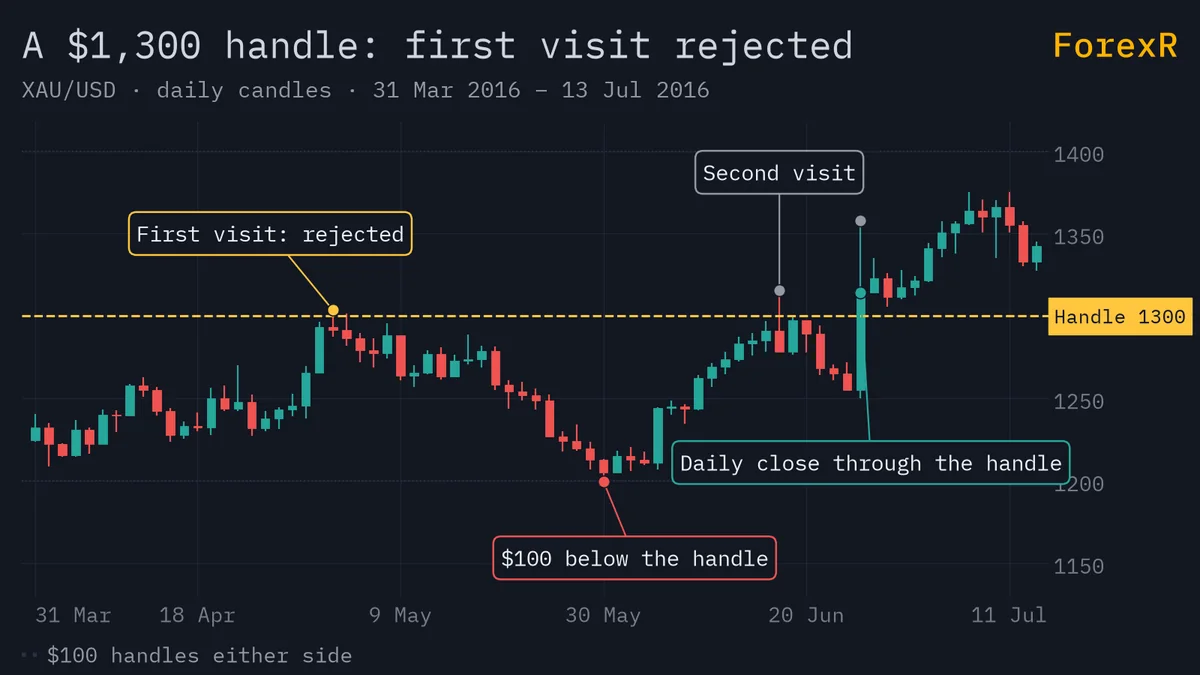
- $100 handles ($3,000 in our example) behave like major stations: expect a reaction on the first visit and a slow grind through on the second or third.
- $50 handles are the smaller stops between them, useful for intraday targets.
- $10 and $25 steps matter on the 5-minute chart and almost never on the daily.
Rule of thumb: never put a stop exactly on a handle. Put it a few dollars beyond, because the handle is where everyone else's stop sits too.
Daily ATR: The Yardstick for Gold Stops and Targets
ATR (average true range) is the average distance a daily candle travels, gaps included. On gold it is the yardstick for every other number, because gold's daily ATR in dollars can more than double within a few months, and a fixed $20 stop that was sensible in a quiet spring is noise by autumn.
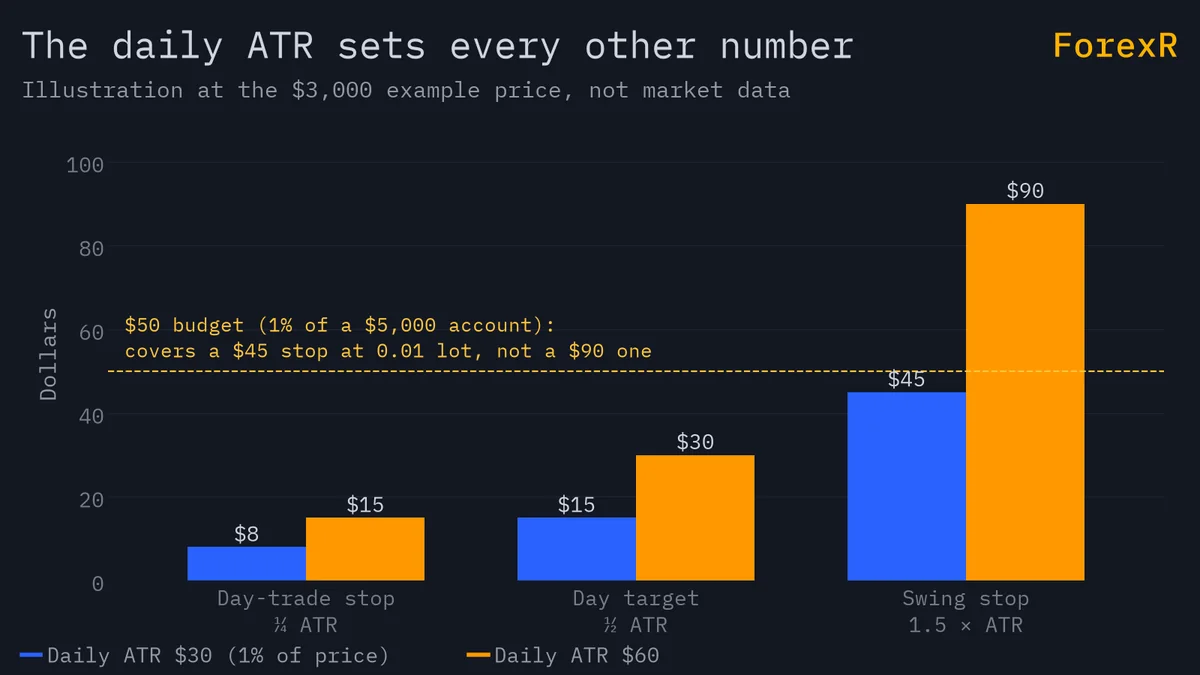
Think of the ATR as the average commute. If your stop is shorter than the commute, ordinary traffic will hit it. A worked example at the example price of $3,000, which is not a forecast:
- Daily ATR: $30, which is 1% of price and an ordinary reading for gold.
- Swing stop: 1.5 × ATR = $45 beyond the level you are trading against.
- Day-trade stop: a quarter of the daily ATR, about $8, placed beyond a handle or the prior hour's extreme.
- Day target: half the ATR, $15; most days do not give you the whole range from your entry.
- Sizing: $5,000 account, 1% risk ($50), $45 stop, so $50 ÷ ($45 × 100) = 0.01 lot.
If the ATR doubles to $60 the stop becomes $90, and the $50 budget no longer buys even 0.01 lot, which would risk $90 or 1.8%: wait, or accept that knowingly. The XAU/USD contract guide goes deeper on ATR stops.
The 50 and 200 Daily Moving Averages on Gold
A simple moving average (SMA) is the average close over a set number of days. On gold the 50-day tells you the swing trend and the 200-day tells you the year's trend, and both work as zones rather than lines: price often overshoots by half an ATR before turning.
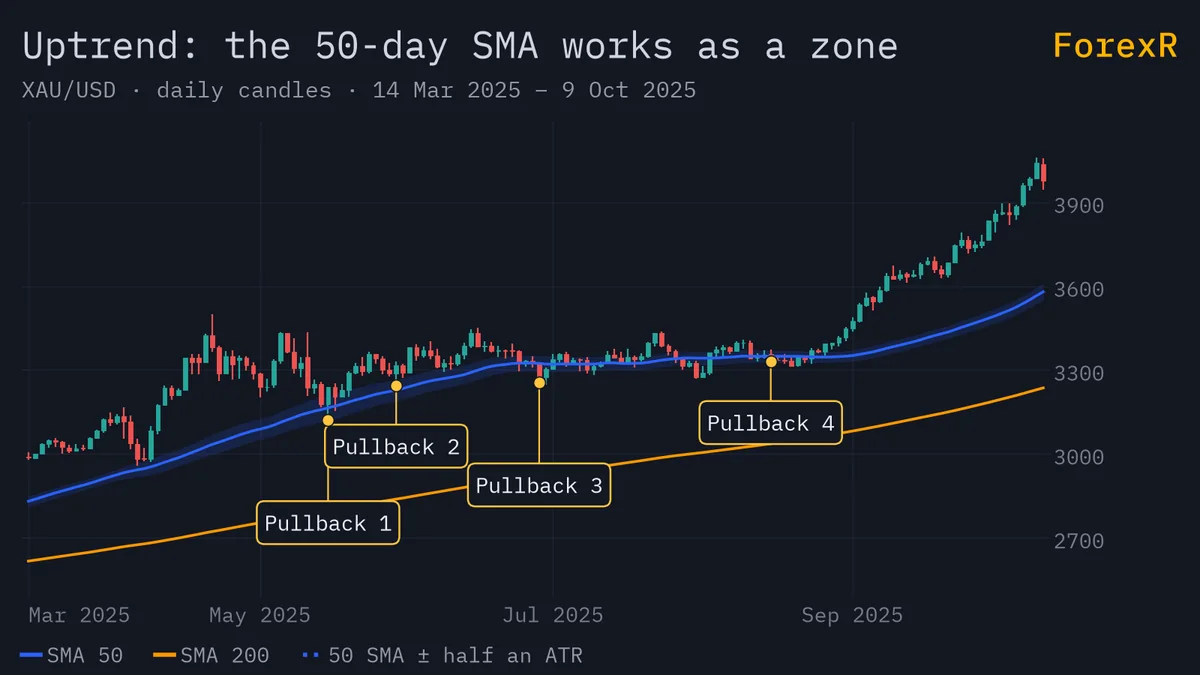
- 50 above 200, price above both: uptrend. Look to buy pullbacks near the 50.
- Price between them: no trend. Range tactics, smaller size or nothing.
- 50 below 200, price below both: downtrend. Rallies to the 50 are where sellers show up.
The cross of the two averages is late by design; treat it as confirmation, never as an entry. Moving averages covers settings and traps, and the gold strategies guide turns the 50 SMA into a full swing rule set.
Prior Day High and Low, and Weekly Pivots
Two levels do most of the intraday work on gold.
- Prior day high and low: yesterday's extremes. New York often tests one of them in the 8 to 11 a.m. window, and a clean break turns it into today's stop-placement level.
- Weekly pivot: computed from last week's high, low and close. Price holding one side of it for three days is a trend hint; the daily pivot is your intraday middle.
Compute both with the pivot point calculator, or read the daily pivot from the live XAU/USD page, which also shows the ATR and a multi-timeframe trend read.
Fibonacci on Gold's Last Swing
Fibonacci retracement divides the last swing into ratios (38.2%, 50%, 61.8%) and marks where pullbacks often pause. Many gold traders watch the 50% to 61.8% zone in a trend because it tends to line up with the 50 SMA. Keep it simple: one swing, the most recent obvious one, each level a zone about a quarter ATR wide.
Worked example: a $200 rise from swing low to swing high. The 38.2% pullback is about $76 back, the 50% is $100 back and the 61.8% about $124 back. Buy at 61.8% with a 1.5 ATR stop of $45 and the swing high is $124 away, close to 3R; buy at 38.2% with the same stop and it is only $76 away, under 2R. The Fibonacci calculator does the arithmetic and the Fibonacci guide explains which swing to pick.
Why Gold Trends Cleanly and Then Spikes
Gold trends because its drivers, real yields and the dollar, trend: a Fed cycle lasts months, not minutes. Gold spikes because the news that updates those drivers arrives at fixed times, CPI and NFP at 8:30 a.m. New York and the FOMC at 2 p.m., and the market re-prices in seconds. Long wicks at news are gold's signature: a candle that travels $40 and closes $5 from where it opened.
Two habits follow. Read wicks as information, not as an entry: a long lower wick into a handle at 8:35 a.m. says buyers defended it, and the next candle's close is your confirmation. And never judge a level on a news candle alone; a level "broken" by a 30-second spike that closes back inside it has not broken.
A Top-Down Gold Chart Routine: Daily, 4-Hour, 1-Hour
A warehouse supervisor in Penang draws his levels on Sunday evening: last week's high and low, the two handles nearest price, the 50 and 200 SMAs and one Fibonacci on the last swing. He then checks the chart for ten minutes at 9 p.m. each night and does nothing unless price is at a level. His routine, in order:
- Daily: trend by the 50 and 200 SMAs, the ATR reading, the nearest $100 handle above and below, the last swing marked.
- 4-hour: the pullback structure, the 20 EMA, and whether price is at a Fibonacci zone or a prior day extreme.
- 1-hour: the entry trigger, a candle closing back from the level, with the stop a few dollars beyond it and sized from the daily ATR.
Higher timeframes decide direction; lower ones decide timing. Multi-timeframe analysis explains how to avoid trading whichever chart happens to agree with you.
How to Read the Key Levels Table
Every daily gold forecast on the gold analysis hub carries a key levels table: the daily pivot, three resistance and three support levels, the previous day's high and low, and the 20-day high and low, with the UTC time the data was taken. Use it as a starting sheet, not a verdict. Try this in five minutes: copy the table onto paper, add the nearest $50 handles yourself, and circle any price where two levels sit within a quarter ATR of each other. Those clusters are where gold reacts most, and a stop just beyond one makes sense.
Before trading any of it, compare gold spreads and minimum stop levels on the broker comparison: a wide spread moves your fill away from every level by its width.
Leveraged gold CFDs carry a high risk of loss. Levels break, the ATR expands without warning and gold can drop $100 in a session; use stops, size from the ATR and risk only money you can afford to lose.
FAQ
Which indicators work best for gold?
Three cover most of it: the daily ATR for stop and target distances, the 50- and 200-day simple moving averages for trend, and daily or weekly pivots for intraday levels. Round-number handles and the previous day's high and low need no indicator at all. Adding more usually adds contradictions rather than information.
What timeframe is best for gold technical analysis?
Use at least two. The daily chart sets direction and the ATR yardstick; the 4-hour or 1-hour chart times the entry against a level. Pure 5-minute analysis without a daily view is where most gold traders get caught on the wrong side of a trend day or a news spike.
Can I use the same chart settings for gold as for EUR/USD?
The indicators are the same, but the distances are not. Gold's volatility has typically been about double EUR/USD's, so the same stop in percentage terms is far larger in dollars, and a $1 move is $100 per lot. Keep the settings, recompute every stop and target from gold's own ATR, and size smaller.
Does gold follow Fibonacci levels?
Often enough to be worth drawing, never reliably enough to trade blind. Treat the 50% and 61.8% retracements as zones about a quarter ATR wide, look for them to line up with a moving average or a handle, and wait for a candle to close back from the zone before entering. Without confirmation a Fibonacci level is just a line.