AI Sentiment Analysis in Trading: News Data Explained

What Is AI Sentiment Analysis in Trading?
AI sentiment analysis uses natural language processing (NLP, software that reads and classifies human language) to score thousands of news headlines as bullish, bearish or neutral. The scores are combined into numbers a trader can scan in seconds: tone percentages, mood scores and news volume. They describe the conversation around a market, not its future.
How a Machine Reads a Headline
An NLP model is trained on a large set of financial sentences that humans have already labelled bullish, bearish or neutral. From those examples it learns which words and phrasings tend to signal each tone, and when a new headline arrives it scores it the same way. “Euro climbs as factory output beats forecasts” reads bullish for the euro; “euro slides as growth outlook darkens” reads bearish; “euro steady ahead of data” reads neutral. One headline means very little on its own, so the engine aggregates. Suppose it collects 200 euro headlines in a day and 120 score bullish while 80 score bearish. Tone is then 60% bullish against 40% bearish, because 120 divided by 200 is 0.6. The value of the machine is not that it reads one story better than you do. It is that it can read ten thousand stories an hour without getting bored, and squeeze them into a handful of numbers you can scan in seconds.
The Numbers a Sentiment Engine Produces
Different providers package the output differently, but the same few measures appear again and again.
- Tone. The share of coverage that reads bullish versus bearish, shown as two percentages.
- Mood score. A single figure, often out of 100, that condenses tone and strength, usually shown next to yesterday's value so you can see the change.
- News volume. How much coverage a market is getting compared with its own normal level, for example as a percentage of its 90-day average. A quiet market at 40% of normal volume is a different animal from one at 300%.
- Trend. The direction of the mood over recent days or weeks, which usually matters more than any single reading.
- Composite scores. A blend of sentiment with other inputs such as price trend and volatility, compressed into one number.
A Worked Example: The Sentiment Block on ForexR Pair Pages
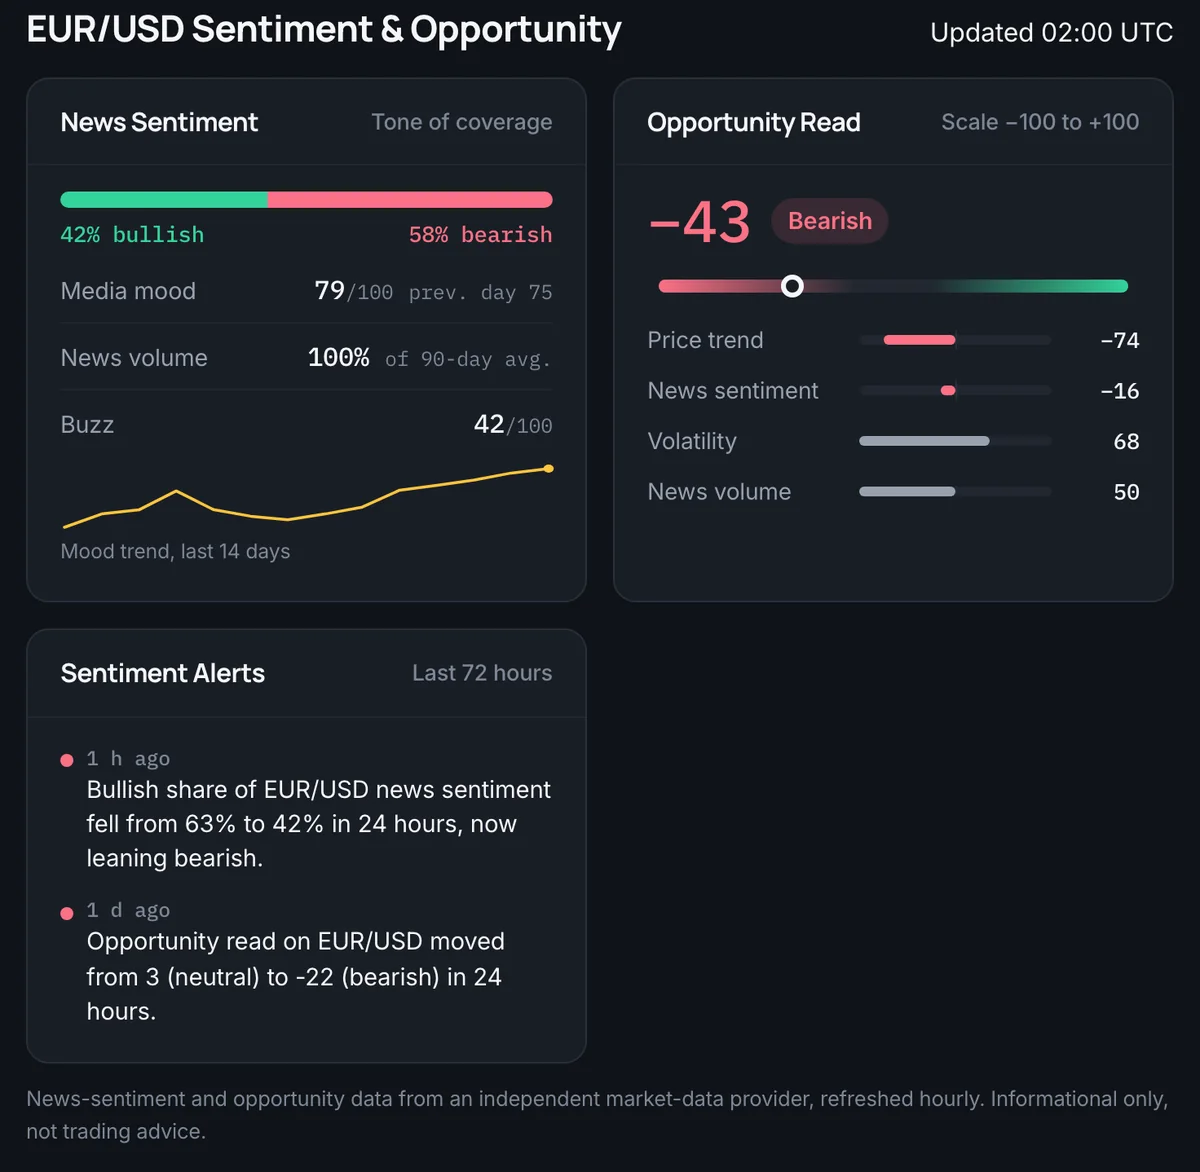
You can study a live version on this site. Many ForexR pair pages, such as the EUR/USD page, carry a block headed “EUR/USD Sentiment & Opportunity”. It refreshes hourly and is sourced from an independent market-data provider. The News Sentiment section shows the tone of coverage as percentages bullish and bearish, a media mood score out of 100 alongside the previous day's value, news volume as a percentage of its 90-day average, a buzz score (a quick read of how much attention the pair is drawing), and a 14-day mood trend. Below it, the Opportunity Read condenses price trend, news sentiment, volatility and news volume into one composite score from −100 to +100, labelled bearish, neutral or bullish. Sentiment Alerts add plain sentences from the last 72 hours, such as “Bullish share of EUR/USD news sentiment fell from 63% to 42% in 24 hours”. The block is labelled informational only, not trading advice, and coverage varies by pair, because some markets simply do not generate enough news to score.
How Traders Use Sentiment Numbers
Sentiment data rarely gives a trade by itself. In practice it plays three supporting roles.
- Confirmation. You already have an idea from your chart, and you check whether the news mood leans the same way. Agreement does not prove you are right, but sharp disagreement is worth a pause and a second look.
- Contrarian extremes. When nearly all coverage points one way, the crowd is often already fully positioned, leaving nobody left to push price further. Some traders treat extreme readings as a warning of a possible turn, not an invitation to join the move.
- A filter before news. Rising news volume around an event on the economic calendar tells you attention is building and moves may be larger than usual. Traders who practise news trading use volume and buzz to decide which releases deserve extra caution.
News Sentiment vs Price: Which Moves First?
Usually price. Journalists write about a move after it happens, the engine scores the story after it is written, and the aggregate number updates after that. So a mood score often tells you, in tidy numbers, what the chart told you hours earlier. That does not make it useless. Sentiment adds breadth, summarising thousands of sources you could never read yourself, and it gives slower, position-level decisions useful context, much as fundamental analysis does. But it does mean you should never treat a sentiment jump as a fresh trading trigger on its own. It is closer to a weather report than a starting gun.
The Pitfalls of AI Sentiment Analysis
Every sentiment feed inherits the weaknesses of its sample, and most of those weaknesses are invisible on a tidy dashboard.
- Headlines lag price. The mood usually follows the move rather than leading it, so a glowing score may describe a rally that is already finished.
- One outlet can dominate. If a single publisher produces half of the scored stories, the “market mood” is really one newsroom's mood.
- Double counting. The same agency story republished across dozens of sites can be scored dozens of times, inflating both volume and tone in the same direction.
- Language is slippery. Sarcasm, hedged wording and headlines that mention several currencies at once still trip classifiers, so individual scores carry error.
- Thin coverage. A minor pair may be scored from a handful of stories, which makes its percentages look precise while meaning almost nothing.
How to Test a Sentiment Feed Before You Trust It
Watch before you act. For a few weeks, note the readings for one pair each day alongside what price then did. You are looking for honest answers to three questions: does the mood lead price or trail it, do extremes mark turns or simply mark strong trends, and does the feed swing wildly on quiet days? Keep the notes in your trading journal so the test survives your memory. Pair the sentiment read with level-based work, which our guide to AI market analysis covers, and judge any paid product against the checklist in AI trading tools. Two rules keep the test clean. First, never enlarge a position because sentiment agrees with you; position size belongs to your risk management rules, not to a mood score. Second, choose where you trade on regulation and execution costs rather than on whose dashboard looks best; compare brokers on those grounds instead.
The Risks of Trading on Sentiment Alone
Sentiment numbers measure conversation, not the future: they lag price, they inherit their sample's blind spots, and an extreme reading can stay extreme for weeks while a trend runs on. No mood score can time an entry or protect your capital. Leveraged forex and CFD trading carries a high risk of loss, and ESMA-era disclosures show 74-89% of retail CFD accounts lose money, so use sentiment as background, never as a trigger, and only risk money you can afford to lose.
FAQ
What is a good sentiment score in forex?
There is no universally good number. A mood score of 70 means little by itself; what matters is how it compares with that market's own recent history and which direction it is moving. Traders pay more attention to changes and extremes than to levels, because a pair can sit at a high score for weeks while price does nothing unusual.
Where does forex sentiment data come from?
Mostly from news coverage: headlines and articles from financial outlets and wire services, collected and scored automatically. Some providers add social media posts or positioning data. The sample matters more than the algorithm, because a feed dominated by one outlet or one region measures that outlet's mood, not the market's. Serious providers describe their sources, even if they keep exact names private.
Does sentiment analysis work for every currency pair?
No. Major pairs generate a constant stream of coverage, so their scores rest on large samples. Minor and exotic pairs may be scored from only a few stories a day, which makes their percentages unstable and easy to over-read. Many tools simply skip pairs with thin coverage, which is more honest than showing a precise-looking number built on ten headlines.
Is paid sentiment data better than free sentiment data?
Not automatically. Paid feeds usually offer bigger samples, longer history and faster updates, but the structural pitfalls, lagging headlines, double counting and thin coverage on minor pairs, exist at every price. Test any feed against price behaviour for a few weeks before paying, and be suspicious of a product that only ever seems to confirm whatever the market just did.