ATR Indicator in Forex: How to Measure Volatility

Intermediate3 min read
Magnificent waves of the stormy ocean captured on a cloudy evening
Image by wirestock on Magnific

What Is the ATR Indicator?

Average True Range (ATR) is a volatility indicator developed by J. Welles Wilder. It does not tell you which direction price is heading — instead it measures how much a currency pair moves, on average, over a given period. A rising ATR means the market is becoming more volatile; a falling ATR signals quieter, tighter conditions.

Because it is expressed in the same units as price (pips for most forex pairs), ATR is intensely practical. It answers a question every trader faces: how far does this pair typically travel, and how wide should my stop be?

How True Range and ATR Are Calculated

ATR is built from a value called the True Range (TR), which captures the full extent of a bar's movement, including any gap from the previous close. For each period, TR is the largest of three measurements:

  • Current High − Low
  • The absolute value of High − Previous Close
  • The absolute value of Low − Previous Close

In formula terms, TR = max(High − Low, |High − PrevClose|, |Low − PrevClose|). The ATR is then the average of the True Range over a set number of periods — the default is 14. So a 14-period ATR on the daily chart tells you the average daily range over the last two trading weeks.

Reading ATR Values

ATR is read in the units of the pair. If EUR/USD shows a daily ATR of 0.0070, that is roughly 70 pips of average daily movement. On XAU/USD (gold), ATR will be far larger because the instrument moves in dollars, not fractions of a cent. This is why you should never compare ATR across different instruments directly — compare a pair to its own history instead.
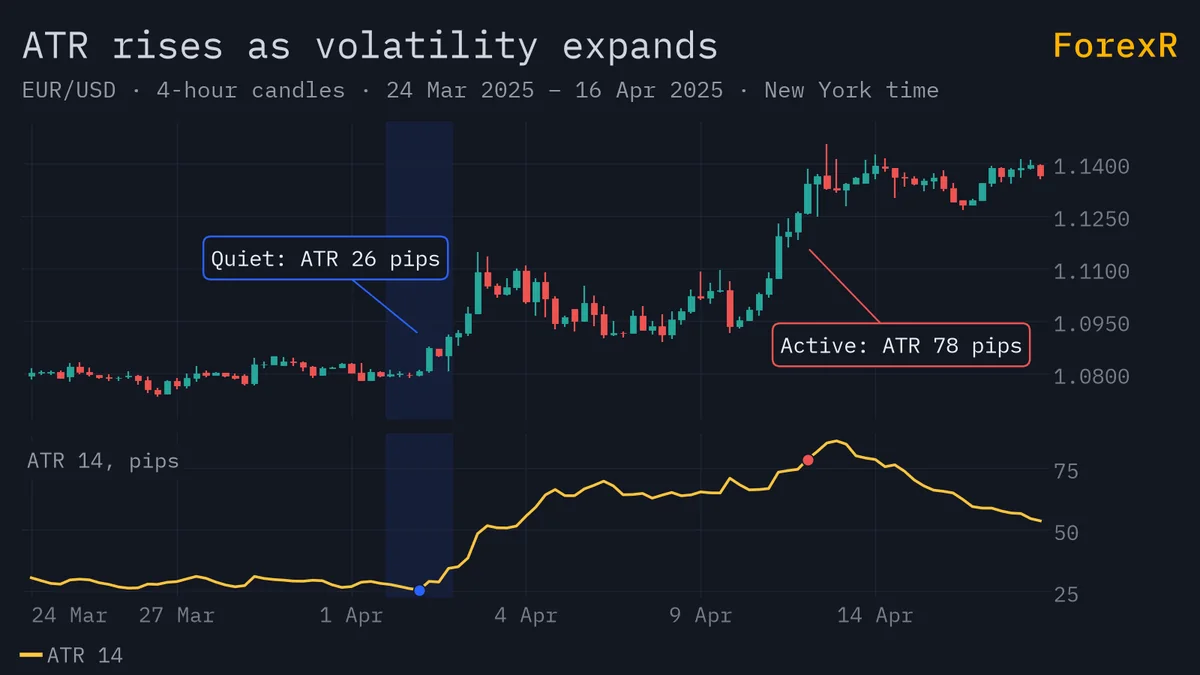
EUR/USD 4-hour candlestick chart with an ATR 14 panel in pips, where a quiet spell with a low, flat ATR is followed by much larger candles and ATR several times higher
Real EUR/USD 4-hour candles. ATR 14 fell to about 26 pips, its lowest in four weeks, then climbed to about 78 pips as the candles grew. ATR shows how far price is moving, not which way.

A low, flat ATR often precedes a breakout, as coiled, quiet markets tend to expand. A spiking ATR usually accompanies news or a strong trend and warns that ranges — and risk — have widened.

How Traders Use ATR

The most popular use is position sizing and stop placement. Rather than using a fixed stop, you can set your stop a multiple of ATR away from entry — say 1.5× ATR — so your risk automatically adapts to current conditions. In volatile markets your stop widens to avoid being shaken out; in calm markets it tightens.
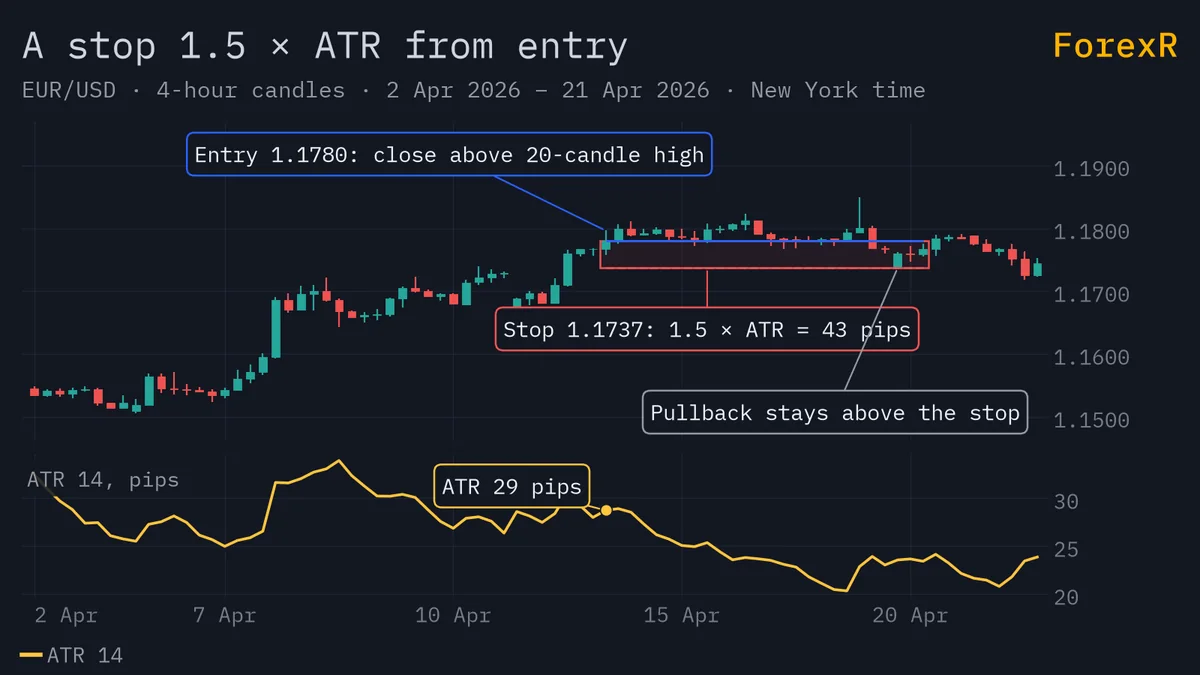
EUR/USD 4-hour candlestick chart with a long entry after a breakout, a stop placed 1.5 times the ATR below it, and an ATR 14 panel showing the value used
A real EUR/USD 4-hour breakout entry. ATR 14 read 29 pips, so a 1.5 × ATR stop sits about 43 pips below the entry. The pullback that followed stayed above it; a much tighter stop would have been hit.

ATR also helps set realistic targets. If a pair's average daily range is nearly used up, chasing another large move that day is optimistic. Traders combine ATR with structure such as pivot points to judge whether a level is within reach given the day's remaining range.

Practical Tips

  • ATR measures size, not direction — always pair it with trend or level analysis.
  • Volatile instruments like XAU/USD need wider stops than quiet pairs, and ATR quantifies that gap.
  • Watch for ATR contraction as an early warning that a breakout may be building.

On TradingView, the browser-based charting platform, the ATR scripts in our Pine Script Library add bands and dashboards built on the same calculation, and trailing stop scripts plot ATR-based exits on the chart. They draw the numbers described here; they do not make the decision for you.

You can check live volatility for major pairs on the free ForexR dashboard before you plan a trade. If you want to test ATR-based stops in practice, a KCM Trade demo account lets you rehearse without risking funds. As always, forex and CFD trading carries a high risk of loss, so manage your position sizes carefully.

FAQ

What is a good ATR setting for forex?

The default 14-period ATR works well for most traders and timeframes. Shorter settings react faster to recent volatility, while longer settings smooth the reading out over more history.

Does ATR predict price direction?

No. ATR only measures the size of movement, or volatility. You still need trend analysis, price action or other indicators to judge which way price is likely to go.

How do I use ATR for stop-loss placement?

A common method is to place your stop a multiple of ATR — such as 1.5 or 2 times — away from your entry. This adapts your stop distance to the market's current volatility.

Free ATR Scripts for TradingView

Open-source Pine scripts from the ForexR library that build on this indicator. Copy one into TradingView's Pine Editor to try it on your own chart.

Free Volatility and Band Pine Scripts · How to add a script to TradingView

Related on ForexR

Next lesson Most Volatile Currency Pairs (and the Calmest): How to Trade Them Continue

More Intermediate Guides

Support and Resistance in Forex: How to Draw Key Levels How to Draw Trend Lines and Channels in Forex (Step by Step) Supply and Demand Zones in Forex: How to Find and Trade Them Forex Candlestick Patterns: Pin Bars, Engulfing, Doji & More Forex Chart Patterns: Reversal & Continuation Explained Forex Breakout Trading: How to Trade Breakouts & Spot Fakeouts Moving Averages in Forex: SMA vs EMA, Crossovers & Trends MACD Indicator Explained: Settings, Signals & Divergence RSI Indicator in Forex: Settings, Signals & Divergence Stochastic Oscillator Explained: Settings, Signals and Strategy Divergence Trading: How to Spot Regular and Hidden Divergence Bollinger Bands Explained: Squeeze, Band Walks & Signals Ichimoku Cloud Explained: A Simple Guide to All Five Lines Forex Pivot Points: Formula, Levels & How to Trade Fibonacci Retracement in Forex: Levels, Drawing & Examples Most Volatile Currency Pairs (and the Calmest): How to Trade Them Best Forex Indicators for Beginners: The 7 Worth Learning Stop-Loss Strategies in Forex: Placement, Sizing & Trailing Take-Profit Strategies: When and Where to Exit a Winning Trade Risk-Reward Ratio Explained: What It Is and How to Use It Position Sizing in Forex: How to Calculate the Right Lot Size Forex Risk Management: Position Sizing & the 1-2% Rule How to Create a Forex Trading Plan (Simple Template Included) Forex Trading Styles: Scalping, Day, Swing & Position Forex Scalping for Beginners: How It Works, Costs and Rules Day Trading Forex: A Realistic Beginner’s Guide and Routine Swing Trading Forex: How to Catch Moves Over Days, Not Minutes Types of Forex Brokers: ECN vs STP vs Market Maker Explained How to Choose a Forex Rebate Provider: 9 Checks to Make First Total Trading Cost Explained: EUR/USD vs Gold After Rebates EA Settings Explained: Lot Size, Magic Number, Stop-Loss & More How to Backtest an EA in the MT4 and MT5 Strategy Tester How to Choose a Safe Forex EA: A 12-Point Checklist Pine Script Indicators vs Strategies vs Libraries Explained Pine Script Basics: Write Your First TradingView Indicator Pine Script Inputs: How to Make Script Settings Adjustable How to Read a Pine Script Before You Trust It: A Checklist How to Edit a Pine Script: Colours, Lengths and Filters Pine Script Alerts: alertcondition(), alert() and Webhooks Pine Script Sessions and Time: Shade London, New York, Asia Pine Script request.security(): Multi-Timeframe Done Safely Repainting in TradingView: How to Spot a Script That Repaints Build a Moving Average Crossover Strategy in Pine Script AI Trading Tools Explained: What Helps and What Sells AI Trading Signals: What They Are and When to Trust One How to Read a Signal Track Record: Win Rate, R and Sample Size AI Market Analysis: How Machines Read the Forex Market AI Sentiment Analysis in Trading: News Data Explained Fundamental Analysis in Forex: What Moves Currencies Safe-Haven Currencies: Risk-On and Risk-Off Explained Gold and the US Dollar: Why They Usually Move Apart Gold and Interest Rates: Why Real Yields Drive the Price Is Gold an Inflation Hedge? What 50 Years of Data Say Gold as a Safe Haven: When It Works and When It Fails Gold Trading Strategies: 5 Setups to Test on XAU/USD Gold Scalping: Costs, Timeframes and Rules for XAU/USD Gold Technical Analysis: Levels, ATR and Round Numbers How to Trade Gold During News: NFP, CPI and Fed Days Gold Correlations: Dollar, Yields, Silver, AUD and Bitcoin Gold-Silver Ratio Explained: How to Read and Trade It Gold vs Bitcoin: Which Is the Better Store of Value? How to Choose a Broker for Gold Trading: 9 Things to Check

Choose a Regulated Broker

Put what you’ve learned to work with a regulated broker. Compare costs, platforms and licences side by side.

Compare top brokers