Gold Supply and Demand: Mines, Recycling, Jewellery and ETFs

Where Does the World’s Gold Supply Come From?
About 4,800-5,000 tonnes of gold enter the market each year: roughly 3,500-3,700 tonnes dug from mines and 1,200-1,300 tonnes melted down from old jewellery and scrap. That sounds like a lot until you set it beside the 210,000-216,000 tonnes already above ground. New supply adds only about 1.5-2% a year to the pile.
Mines are spread across every continent. The largest producers include China, Russia, Australia, Canada, the United States, Kazakhstan, Mexico, Indonesia, Ghana and South Africa, so no single country controls the tap the way a few do for oil. The seven drivers of the gold price give mine supply one line; this guide gives it the numbers.
Why Gold Supply Cannot Respond to Price
A wheat farmer who sees a high price plants more next season. A gold miner who sees a high price starts a process that takes 10-20 years from discovery to first production: drilling, studies, permits, financing and construction. By the time the ore flows, the price that justified it may be long gone.
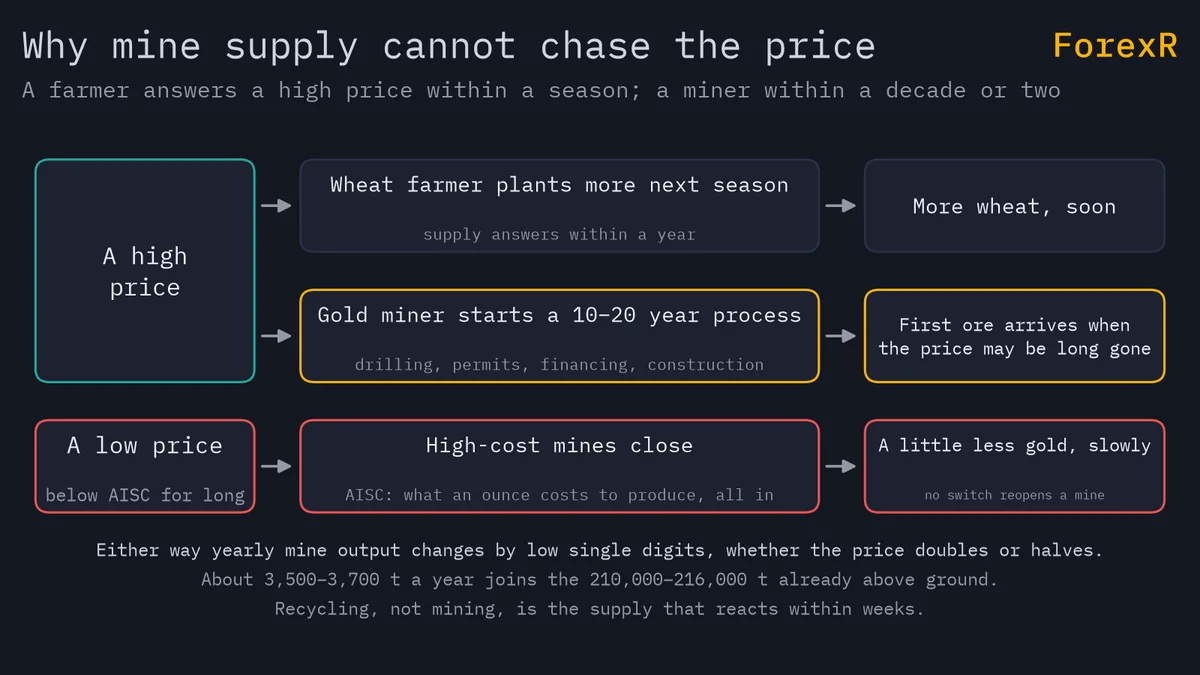
The industry measures what an ounce costs to produce as the all-in sustaining cost (AISC), which folds in mining, processing, exploration and the capital spent to keep the mine running. When the price sits below a mine’s AISC for long, that mine closes, and a closed mine does not reopen with a switch. This is why yearly mine output changes by low single digits whether the price doubles or halves. Traders who wait for a supply squeeze to lift gold usually wait a long time; the history of gold’s cycles shows that real yields and the dollar did the heavy lifting in every big move.
Recycling: The Supply That Does React
Recycled gold is the flexible part. Old chains, broken bangles, dental gold and factory scrap come back to refiners, and this flow rises sharply when one of two things happens: the price jumps, so households cash in, or the economy weakens, so households need the cash. In a downturn both can arrive together.
Think of it as the market’s pressure valve. A price spike pulls metal out of drawers within weeks, far faster than any mine, and that extra supply is one reason vertical rallies in gold tend to slow. The reverse holds too: when the price falls, people keep grandmother’s bangles, recycling dries up and supply tightens a little.
Who Buys Gold Each Year?
Demand splits into four buckets, and the shares below are approximate figures from industry-body data for recent years.
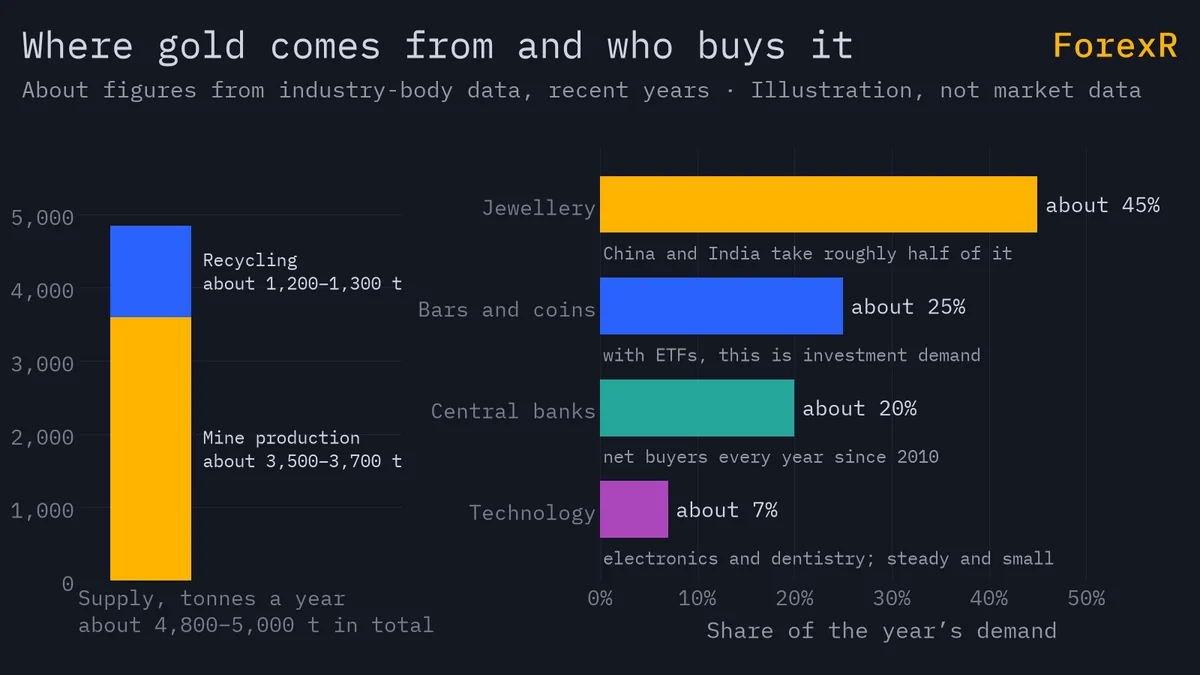
- Jewellery, about 45%: the largest bucket, with China and India together taking roughly half of it. Much of it in India, Malaysia and the Gulf is 22-karat (916); the karat and fineness guide covers the gold content, and the gold seasonality guide covers its festival calendar.
- Bars and coins, about 25%: kilobars in Asia, sovereign coins such as the Krugerrand and the Maple Leaf in the West, small bars everywhere. Together with ETFs this is investment demand.
- Central banks, about 20%: much higher than a decade earlier. They were net sellers for two decades to 2009 and have been net buyers every year since 2010; central bank gold buying has the detail.
- Technology, about 7%: connectors in electronics and some dentistry. Steady, small and price-insensitive, because the amount in any one device is tiny.
ETFs: The Swing Buyer
Exchange-traded funds sit inside investment demand but deserve their own line because they swing. A gold ETF is a fund that holds bars in a vault and trades as a share; when investors buy, the fund buys physical gold, and when they sell, it sells. The first large US-listed fund launched in 2004, and by 2020 global ETF holdings had peaked at about 3,900 tonnes. That is more gold than Germany’s official reserves of about 3,350 tonnes, gathered in sixteen years by people clicking buy in brokerage accounts.
ETF flows are the demand line that can turn from strongly positive to negative within a year, which makes them the physical buyer most worth watching quarter by quarter. The routes to owning gold compare ETFs with the alternatives.
How Each Buyer Behaves When the Price Rises
Jewellery buyers spend a budget, not a weight. A family planning a wedding sets aside a fixed sum in rupees or ringgit, and when the price rises they buy lighter pieces or fewer of them. Investors do the opposite: a rising price attracts them and a falling price scares them off. So jewellery demand leans against the price while investment demand leans with it.
Work it through at the example price of $3,000 an ounce, which is an example, not a forecast. One gram of pure gold costs about $96.45, so a $3,000 jewellery budget buys about 31 g of fine gold. If the price rises 10%, the same budget buys about 28 g. Across millions of households the jewellery bucket shrinks in tonnes even as it grows in dollars. Meanwhile an ETF investor seeing the same 10% rise may add, not cut. When the buckets pull opposite ways on a fall, jewellery buyers stepping in as investors flee, the market finds a floor; when investors and central banks buy while jewellery fades, the price is being carried by the smaller, faster money.
Why a 200,000-Tonne Stock Is Priced at the Margin
Almost every ounce ever mined still exists, so gold is not like wheat, which is eaten. About 210,000-216,000 tonnes sit above ground in vaults, jewellery boxes and central banks, roughly a 22-metre cube, as the why-gold-has-value guide describes. Against that pile, a year’s mining is a rounding error.
Prices in a market like this are set by the small share that changes hands, the same way a city of 200,000 flats gets its house prices from the few hundred sold this month. One tonne is 32,150 troy ounces, so at the example price of $3,000 a tonne is worth about $96 million (32,150 × 3,000). A 100-tonne swing in ETF holdings over a quarter is therefore roughly $9.6 billion of buying or selling that must find a counterparty among holders who mostly are not selling. That is why flows at the margin, not the size of the stock, move the quote on the live XAU/USD page.
What People Get Wrong About Mine Supply
The belief runs: mines are running out of easy gold, so supply must fall and the price must rise. The first half is a fair worry for any single mine. The conclusion does not follow. Even if world mine output fell by a tenth, the above-ground stock would still grow by well over 1% a year, and the 200,000 tonnes already mined would still be available to any seller at the right price. Gold fell for two decades after 1980 and rose about seven-fold from 2001 to 2011; neither move was a supply story. Supply matters over decades; it has never decided a quarter.
How to Read a Quarterly Demand Report
A part-time trader in Penang reads the quarterly industry report at lunch and used to look only at the headline total. Now she reads the four buckets separately, notes whether ETF flows and central banks pulled the same way, and checks which direction jewellery went in tonnes rather than dollars. The report tells her who was buying last quarter, not what gold will do next week.
Try this in five minutes. On a piece of paper, write the four buckets: jewellery, bars and coins plus ETFs, central banks, technology. Next to each, write whether the latest report showed it up or down on the year. Then open the monthly chart on the live gold page and mark what the price did over the same quarter. Do it for four reports and you will see how loosely the two line up, which is the lesson. The daily forecasts in the gold analysis hub work on the drivers that move gold over days, and supply and demand is not one of them.
None of this makes gold safe: prices fell for four years from 2011, and a leveraged CFD on gold, whichever of the brokers you compare you use, carries a high risk of loss; gold can fall hard and fast, and ESMA-era disclosures show 74-89% of retail CFD accounts lose money. Risk only money you can afford to lose.
FAQ
Which country produces the most gold?
No single country dominates. The largest mining nations include China, Russia, Australia, Canada, the United States, Kazakhstan, Mexico, Indonesia, Ghana and South Africa, and the order among them shifts from year to year. Because output is spread so widely, and because a year of mining is only about 1.5-2% of the gold already above ground, no producer can move the price the way a large oil exporter can.
Will the world run out of gold?
Not in any sense that matters for the price. Almost every ounce ever mined still exists, because gold does not corrode and is rarely consumed; technology takes about 7% of demand and much of that is eventually recycled. Individual mines run out, and new ones take 10-20 years to build, but the 210,000-216,000 tonnes above ground can always be sold if the price is right.
What happens to gold demand in a recession?
The buckets move in different directions. Jewellery demand usually falls because households have less to spend, recycling rises because people sell old pieces for cash, and investment demand often rises as savers look for something outside the banking system. In a sudden liquidity crunch, as in 2008 and March 2020, investors sold gold first to meet margin calls before buying returned.
Is recycled gold worth less than newly mined gold?
No. Refiners melt scrap and old jewellery back to 999 or 9999 fineness, and every pure gram is chemically identical to every other, whichever mine or bangle it came from. A recycled bar from an accredited refiner trades at the same price as one made from fresh ore. The only discount is the one a dealer applies when buying your scrap below spot.