Central Bank Gold Buying: Why They Buy and What It Does to Price

Why Do Central Banks Buy Gold?
Central banks hold about 35,000 to 36,000 tonnes of gold, roughly a sixth of everything ever mined, and they have added to it every year since 2010. They buy because gold is no one's liability, sits outside any other country's payment system and spreads reserves held mostly in dollars and euros. In 2022 they bought about 1,080 tonnes, a record.
Why gold has value gives the one-paragraph version. This guide goes deeper: how much they hold, how two decades of selling turned into record buying, what that does to price and over what horizon, and what to do with a "central bank bought X tonnes" headline.
How Much Gold Central Banks Hold
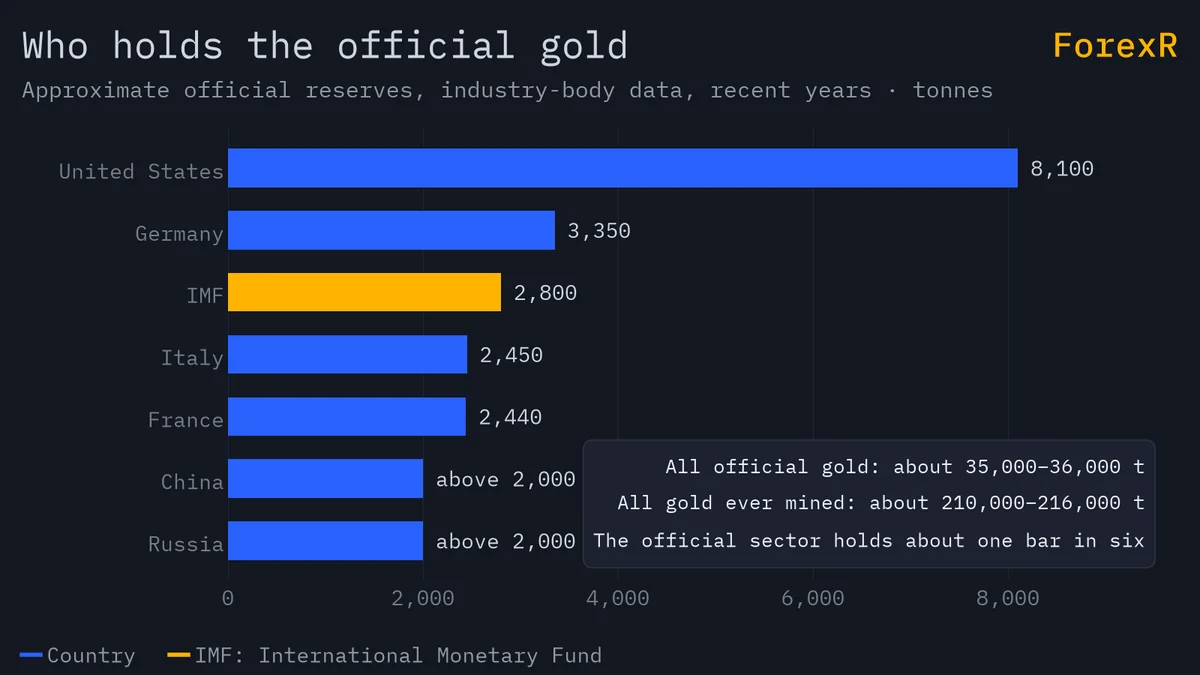
The United States holds about 8,100 tonnes, Germany about 3,350, the International Monetary Fund about 2,800, Italy about 2,450 and France about 2,440; China and Russia each hold above 2,000. Set against the roughly 210,000-216,000 tonnes ever mined, the official sector owns about one bar in six.
A rental deposit is the closest everyday thing. It earns nothing, sits idle for years, and you would rather not touch it, yet it is what makes a stranger trust you and it is there on the day the relationship breaks down. Reserve gold works the same way: no interest, a storage bill, and a job that is simply to exist.
From Sellers to Buyers: The Two-Decade Selling Era and the 2010 Turn
For about two decades up to 2009 central banks were net sellers. The United Kingdom sold about 395 tonnes between 1999 and 2002 at an average near $275, and Switzerland sold after 2000. Official selling weighed on gold through its 20-year bear market, which the price-history guide covers cycle by cycle, until the Washington Agreement of September 1999 capped European sales at 400 tonnes a year.
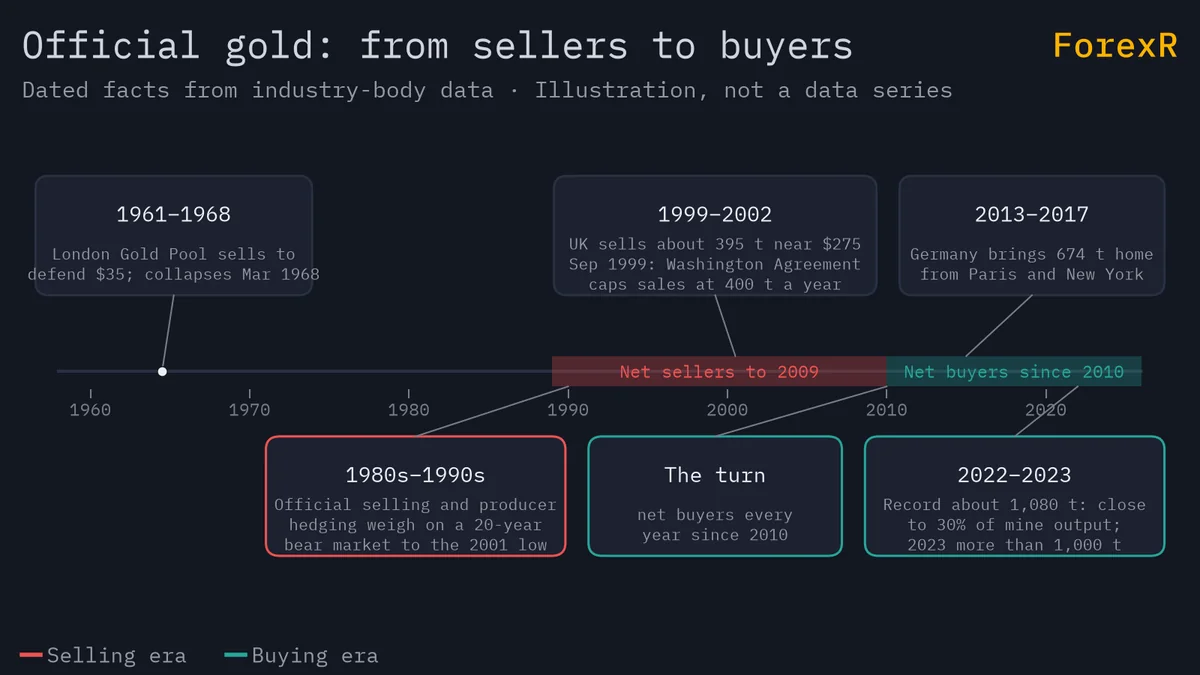
Then the direction flipped. Central banks have been net buyers every year since 2010. In 2022 they bought about 1,080 tonnes, the most on record, and in 2023 more than 1,000 tonnes again. Put that beside supply: mines produce about 3,500-3,700 tonnes a year, so in 2022 the official sector alone absorbed close to 30% of a year's mine output. A buyer that pays no attention to the chart took nearly a third of what the world's mines dug up.
What people get wrong is to call central banks the "smart money" in gold and try to follow them. Look at the timing: they sold through the 1990s and into the 1999-2001 low, near $275, and bought at record pace after prices had risen for a decade. Their buying is reserve policy, not price timing. It tells you about the regime, not about next month.
The Motives: Diversification, Sanctions Risk and No One's Liability
World Gold Council surveys of reserve managers find three motives.
- Diversification: most reserves are dollar and euro bonds. Gold moves differently from both, so a slice of it lowers the swings in the whole portfolio.
- No counterparty and no one's liability: a bond is a promise by a government; a deposit is a promise by a bank. A bar in your own vault is a promise by nobody. It cannot default and no issuer can freeze it.
- Freedom from another country's payment system: after Russia's foreign reserves were frozen in 2022, this motive was cited far more often. Gold held at home stays usable whatever happens to foreign clearing access.
Industry reports name the central banks of China, Poland, Turkey, India, Singapore and Kazakhstan among the large recent buyers. The list is qualitative on purpose: the ranking changes every quarter, and the pattern (economies with large dollar holdings adding gold) matters more than the order.
The German Repatriation: A Story About Trust
Between 2013 and 2017 Germany moved 674 tonnes of its gold home from Paris and New York. Nothing was bought or sold; the point was to have the metal where the ledger said it was, and it took four years of shipping, weighing and re-testing.
Reserve managers do not hold gold for its yield or its chart; they hold it so that, in the worst case, they own an asset that depends on nobody's promise, and where it sits is part of that. It is the logic that separates allocated gold from unallocated, which the London benchmark guide touches on.
How Holdings Are Reported and How Markets React
Central banks report their holdings to the International Monetary Fund monthly, with a lag, and the industry's quarterly reports add up the totals. The People's Bank of China publishes its reserves, including gold, around the 7th of each month; a month in which the figure rises, pauses or resumes can move gold on the day. The economic calendar guide shows how to track releases like this beside the US data.
Scale the numbers at the example price of $3,000 an ounce, an example and not a forecast. One tonne is about 32,150 troy oz, so one tonne is worth about $96 million. A 20-tonne monthly purchase, a large one for a single bank, is about $1.9 billion. A 100-tonne year is about $9.6 billion. London clears gold worth tens of billions of dollars every day, so a whole year of one bank's buying is smaller than a single London session. That arithmetic is why this demand moves the price over quarters, not days.
A day trader in Jakarta sees a headline at 9 a.m. that a central bank added to its reserves last month, and gold ticks up a few dollars. By lunch the move has faded and the day's range looks like any other. He had expected a trend; he got a data point.
Why This Demand Supports Price Over Quarters, Not Days
Central banks buy for years at a time, they buy on dips rather than chasing, and they rarely sell back. Over recent years they have taken about 20% of annual demand, much more than a decade earlier. The supply-and-demand guide puts that beside jewellery, bars, ETFs and technology. A buyer that steady does two things: it raises the level around which the price swings, and it shortens the falls, because there is a bid underneath that does not care about the chart.
It does not set a floor. Central banks were net buyers every year from 2010, including 2013, and gold still fell about 28% that year, its worst in decades. Rising real yields and ETF outflows swamped official buying. The drivers guide ranks real yields and the dollar above official demand for a reason. Central bank buying is the slow tide; yields and the dollar are the waves, and on any given day the waves win.
How a Trader Should Treat a Central Bank Headline
- Check the horizon: the headline describes last month or last quarter. It is context for a swing or position trade, not a day-trade trigger.
- Check what else is moving: if real yields and the dollar are rising, official buying will not save a long that week.
- Do not add size on the news: the first move on a reserve release is small and often reverses; the news-trading guide covers the spike-and-retrace pattern.
- Use it for the base case: steady official buying is a reason to prefer buying dips to selling rallies over months, while the daily plan still comes from the chart, the ATR and the levels on the live gold page.
- Pick a broker for holding: a position held for a quarter pays swap every night, so compare long swap and the triple-swap day on the broker comparison page before treating any thesis as a hold.
Try this in five minutes. Mark the 7th of each of the next three months on your calendar. On each date, note gold's price an hour after the People's Bank of China release and at the daily close, and write both beside the day's ATR. After three months you will know, in dollars, how much of a day's range a reserve headline is worth, and it is usually less than you expected.
Leveraged gold CFDs carry a high risk of loss. Central bank buying did not stop a 28% fall in 2013 and will not stop the next one; gold can fall hard and fast whatever the official sector is doing. Only risk money you can afford to lose.
FAQ
Which country has the most gold reserves?
The United States, with about 8,100 tonnes. Germany holds about 3,350 tonnes, the International Monetary Fund about 2,800, Italy about 2,450 and France about 2,440, while China and Russia each hold above 2,000 tonnes. Together the official sector holds about 35,000 to 36,000 tonnes, roughly a sixth of all the gold ever mined. Figures are approximate industry estimates.
Why did central banks sell gold in the 1990s?
Gold had been falling since 1980, real yields on government bonds were high, and many reserve managers preferred assets that paid interest. Sales by the United Kingdom, Switzerland and others added supply near the low. In September 1999 the Washington Agreement on Gold capped European sales at 400 tonnes a year, and by 2010 the official sector had turned into a net buyer.
Does central bank gold buying make the gold price go up?
It supports the price over quarters and years by adding a steady, price-insensitive bid, and it has made up about 20% of demand in recent years. It does not set a floor. Central banks were net buyers in 2013 and gold still fell about 28% that year, because rising real yields and ETF selling outweighed them. Treat it as background, not a trigger.
When does China report its gold reserves?
The People's Bank of China publishes its foreign reserves, including gold, around the 7th of each month. Other central banks report to the International Monetary Fund with a lag, and industry bodies compile the totals each quarter. A change in the reported figure can move gold for a few hours on the release day, though the effect is usually small against the daily range.