Gold Seasonality: Festivals, Weddings and What the Data Say

Is There a Gold Seasonality Pattern?
Yes, but it is faint. Physical buying clusters around India’s festivals and wedding seasons and China’s Lunar New Year, and studies of monthly returns have found some months stronger than others. The gap between the best and worst months is small, many years break the pattern, and the results changed after 2000. It is a filter, not a signal.
Seasonality means a tendency for a price to behave differently at certain times of year. In gold the story starts with real people buying real metal, so that is where this guide starts, before the data and why they disappoint anyone hoping for a calendar that trades itself.
The Physical Calendar: Festivals and Weddings
Jewellery is about 45% of gold demand and China and India take roughly half of it, so their calendars matter more than anyone else’s. The gold supply and demand guide has the full breakdown; here is the calendar.
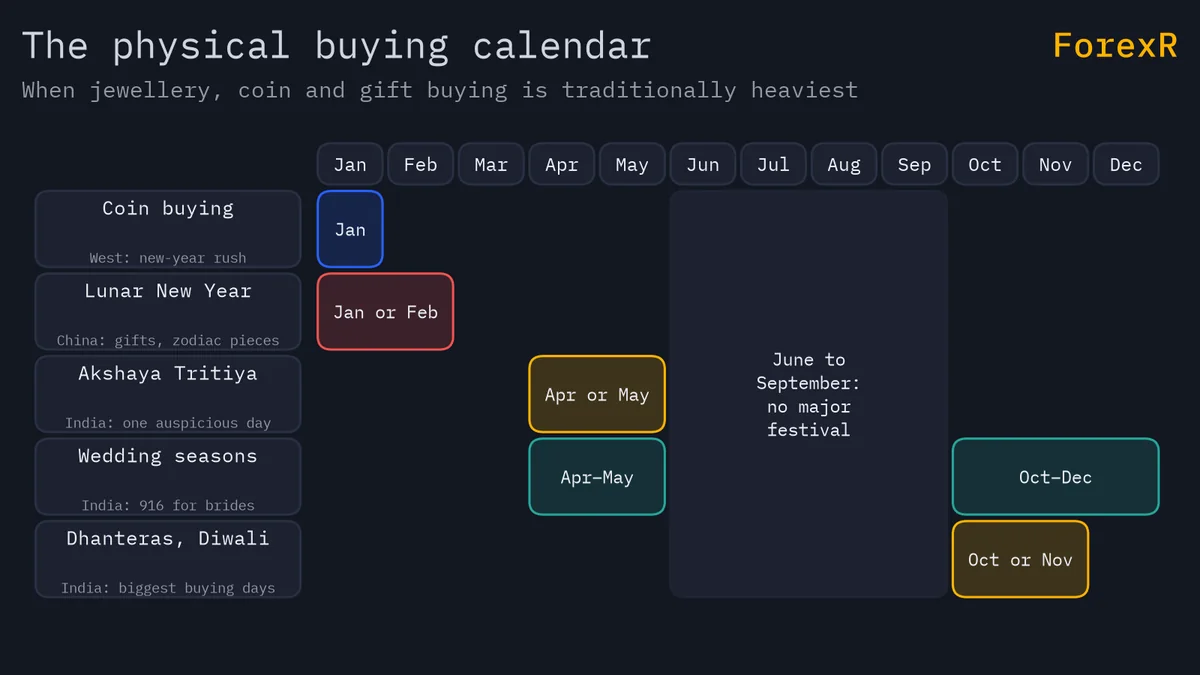
- Dhanteras and Diwali (October or November): the most auspicious days of the Indian year to buy gold. Shops stay open late and queues form for coins and light jewellery.
- Wedding seasons (roughly October to December and April to May): Indian families buy 916 jewellery for brides, planned months ahead.
- Akshaya Tritiya (April or May): a single day when buying gold is believed to bring lasting prosperity; dealers and refiners stock up for it weeks in advance.
- Lunar New Year (January or February): China’s gift season, with bars, pendants and zodiac pieces bought for family and for luck.
- January coin buying: in the West, mints and dealers see a new-year rush for sovereign coins such as the Maple Leaf and the American Eagle.
Notice how much of this sits in the last and first quarters. That is the physical reason people expect gold to be firmer from late summer into the new year and softer in between.
What Monthly-Return Studies Have Found
Researchers have sliced decades of monthly gold returns by calendar month. The broad finding is that late summer and early autumn, August into September, and the weeks around January have historically shown the strongest average months, while stretches around March and June have been weaker. That lines up loosely with the physical calendar: dealers stock up ahead of Diwali and the wedding season, and the new year brings coin and Lunar New Year buying.
Two things are missing from that summary on purpose. There is no average return for any month, because the figure changes with every start date and every data source, and quoting one would make it look like a promise. And there is no ranking, because the order of the middle months reshuffles with the decades chosen.
Why the Seasonal Effect Is Weak and Unstable
Three problems stop the pattern from being a strategy.
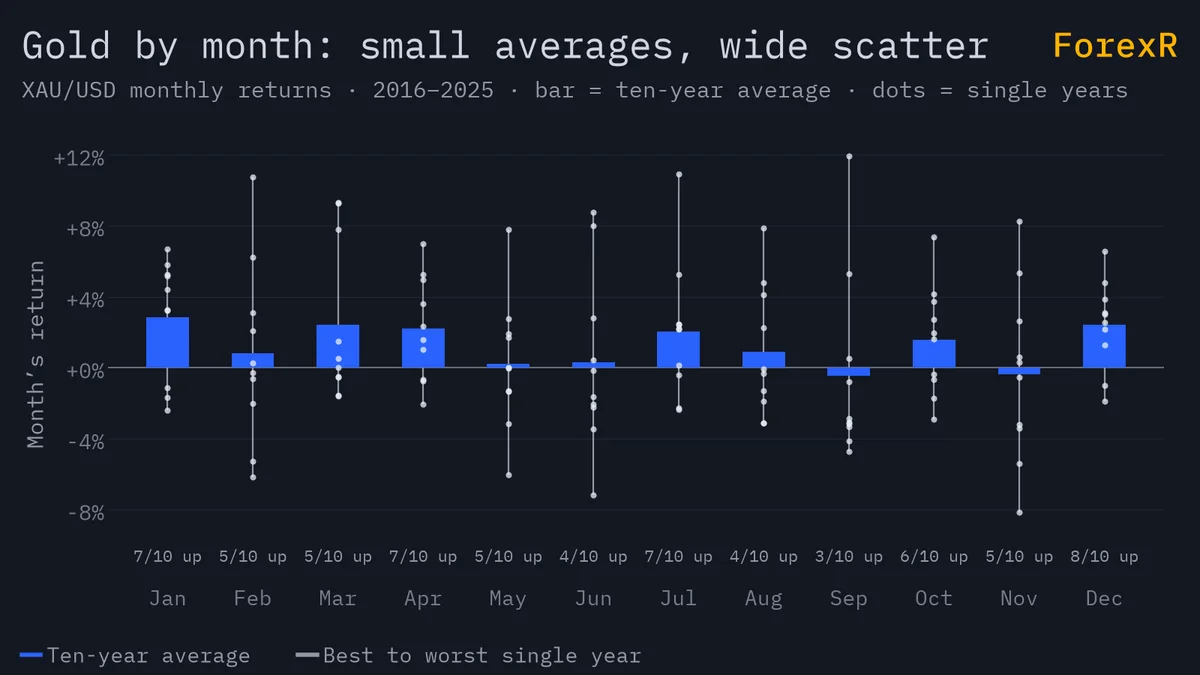
- The spread is small: the gap between the best and worst average months is a fraction of a normal month’s move. Gold’s annualised volatility has typically been about 15%, so an ordinary month moves several percent either way, and a seasonal tilt is buried inside that noise.
- Many years break it: a “strong” month has finished down in a large share of years, and a “weak” one has finished up. The average is carried by a few big years, not by a steady drift.
- The pattern moved: results before 2000 and after 2000 differ, one likely reason being that ETF and central bank demand, which have no festival calendar, grew far larger after 2004 and 2010.
One dated example says it plainly. April to May is wedding and Akshaya Tritiya season, a stretch the physical calendar marks as supportive. On 12-15 April 2013 gold fell about 13% in two trading days, the largest two-day drop in about 30 years, and it finished the year down about 28%. Jewellers across India were buying that spring; the price fell anyway, because investors were selling far more than brides were buying. The gold price history guide puts that year in its cycle.
What People Get Wrong: Seasonality as an Entry Signal
The mistake is turning a tendency into a rule: “buy gold in early autumn, sell in the new year.” Said that way it sounds like a plan. The evidence supports something weaker: over many decades, the average of those months has been a little higher than the average of others, with a wide scatter around it and no guarantee for any single year. A tendency tells you which way the wind has usually blown, not whether it is blowing today. Traders who buy on the calendar and hold through a real-yield shock or a dollar rally discover that the driver in charge does not read festival dates; the seven drivers always outrank the season.
A Worked Example: When the Edge Is Smaller Than the Costs
Suppose a study you trust suggests a seasonal tilt worth 0.5% over one month. Take the example price of $3,000 an ounce, an example, not a forecast, and a 0.10-lot position, which is 10 ounces. A 0.5% move is $15 an ounce, so the whole expected edge is $150.
Now the costs. A $0.30 spread costs $3 per 0.10 lot round trip. A long swap of −$4 per 0.10 lot per night, the same example figure as the gold spread and swap guide uses, runs for 30 nights plus four triple-swap nights: 38 × $4 = $152. Spread plus swap comes to $155, more than the $150 the tilt was supposed to earn. The average edge is gone before the trade starts, and the scatter around it, several percent either way, remains. Check your own numbers with the spread cost calculator; on a swap-free account the swap line falls away but the scatter does not.
Why Known Demand Rarely Moves the Price
Airfares rise in the school holidays and everybody knows it, so nobody profits by discovering it: the airline already priced it in. Gold’s festival demand is the same. Refiners, importers and dealers buy their Diwali stock months in advance, spreading the demand across the calendar, and any trader who could front-run the season has been doing so for decades, which flattens what is left. Demand that everyone can see on a calendar is the least likely demand to surprise the price. Surprises come from the news that lands on the day, which is why the guide to trading gold during news is worth more to a gold trader than any seasonal chart.
How to Use Seasonality Honestly
A swing trader in Chennai whose cousin marries in November does not buy gold because of the wedding. She uses the season as a note in the margin: in the fourth quarter, physical buyers are more likely to appear on dips, so a pullback to support in October may find a bid a little sooner than the same pullback in June. Her entry still comes from the chart and her stop still comes from the ATR on the live XAU/USD page.
Used that way, seasonality does two modest jobs. It can be a filter that lets you take a setup you already like with slightly more confidence, or skip a counter-trend short during a heavy physical month. And it can set expectations for how dips behave: more physical bid means shallower pullbacks, not a rising price. Neither job involves a calendar telling you to click buy. The rule sets in the gold strategies guide all work from price and volatility first; seasonality is the last column in the checklist. Months are also the weaker clock: the far better-evidenced pattern in gold is the time of day, covered in the best time to trade gold guide.
Try this with a piece of paper and the monthly chart. For each of the last ten years, write whether gold closed the October-to-December quarter higher or lower than it opened, then do the same for March. Count the exceptions. You will find the pattern is real enough to notice and unreliable enough that you would not have wanted to bet on it blind; log the result in the journal described in the backtesting and journal guide.
Leveraged gold CFDs, whichever of the brokers you compare you use, carry a high risk of loss, and a seasonal tilt gives no protection when gold falls hard and fast, as it did in April 2013. Risk only money you can afford to lose.
FAQ
Is Diwali a good time to buy physical gold?
For the occasion, yes; for the price, it makes little difference. Festival demand is known months ahead and dealers stock up early, so any effect on the spot price is small and unreliable. What changes your cost far more is the shop’s premium and making charge, often 5-25% of the gold value. Buy for the wedding or the festival, not because the calendar predicts a rally.
Does the gold price usually fall in summer?
Monthly-return studies have found the stretch around June somewhat weaker on average, sitting between the spring and autumn physical seasons, but the tendency is small and has failed in many individual years. Gold set a record above $2,000 in August 2020, in the middle of a summer, which no seasonal table predicted. Treat summer softness as a curiosity, not as a reason to sell.
Is there a best month to buy gold?
Not one you can rely on. The difference between the strongest and weakest average months over past decades is smaller than an ordinary month’s move either way, and the ranking changes depending on which decades you measure. For a physical buyer, the premium and buy-back spread matter more than the month. For a CFD trader, spread, swap and the current driver of the price matter more.
Why does India’s gold import duty matter for demand?
India imports most of its gold, and the government changes the import duty from time to time. A higher duty raises the local price above the world price, which pushes some demand into unofficial channels and reduces the official import figures; a cut does the reverse. A jump or drop in reported Indian demand is sometimes a duty story rather than a change in how much gold families buy.