Price Action Trading: Market Structure, Zones & Liquidity

Reading the Market Without Indicators
Price action trading means making decisions from price itself: the sequence of swing highs and lows, the zones where price turned sharply, and the way candles behave when those zones are revisited. Indicators are calculations derived from price, so they confirm what has already happened. Reading the raw chart does not make you faster than the market, but it keeps your attention on the things that actually cause moves — orders resting at obvious levels — rather than on a line that summarises them afterwards. It is not dogma, though. Plenty of price action traders still use a volatility measure to size their stops.
Market Structure: The Backbone
Structure is simply the pattern of swings. If you are comfortable with reading a forex chart, you already have the raw material.
- Uptrend: higher highs (HH) and higher lows (HL). Buyers are willing to pay more on each push and step in earlier on each dip.
- Downtrend: lower highs (LH) and lower lows (LL). Sellers are in control and rallies are being sold.
- Range: highs and lows roughly level, with neither side in control.
Take a hypothetical EUR/USD sequence on the 1-hour chart: a swing low at 1.0800, a high at 1.0880, a higher low at 1.0840, then a higher high at 1.0920. The uptrend remains intact for as long as 1.0840 holds. That level is where the structure would be proven wrong, which makes it the most important price on the chart.
Break of Structure
A break of structure (BOS) happens when price takes out the swing point that defines the trend. In the example, a continuation BOS is a push above 1.0920, confirming the uptrend. A reversal signal — often called a change of character — is a move below the higher low at 1.0840, because buyers have failed to defend the level they previously defended.
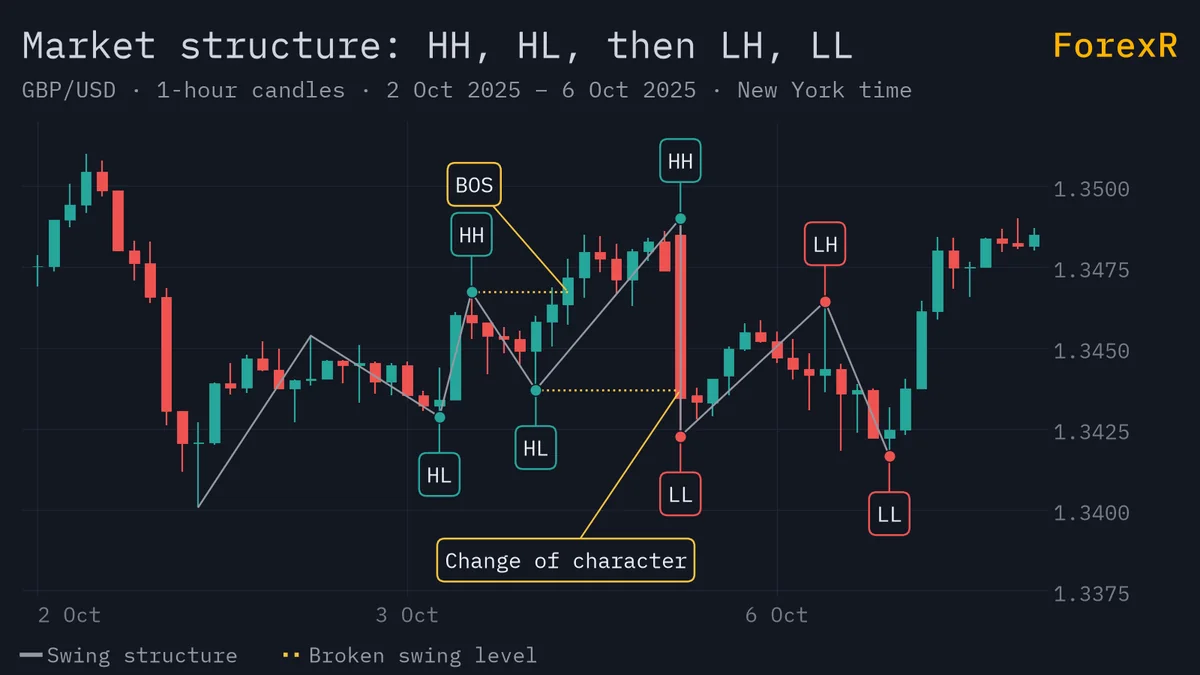
Most traders require a candle close beyond the level, not merely a wick through it. That distinction matters a great deal, as you will see with liquidity sweeps. It also matters which timeframe you are reading: a 15-minute BOS inside a daily uptrend is usually just a pullback, which is why structure should be read top-down using multi-timeframe analysis.
If you chart on TradingView, the browser-based charting platform, free market structure scripts can label swing highs, lows and breaks automatically. Check their labels against your own reading before trusting them.
Supply and Demand Zones
A demand zone is the area where a strong rally began; a supply zone is where a sharp sell-off began. The idea is that a violent move away from a small base suggests more orders were waiting there than could be filled, so some may remain when price returns. Zones are related to classic support and resistance, but they are drawn as areas rather than lines, typically from the base candle’s extreme to its body.
Better zones tend to share a few traits: price left them quickly with large candles, the move broke structure, the zone has not been revisited yet, and it sits in the direction of the higher-timeframe trend. Each retest consumes resting orders, so a zone tested three or four times is weaker, not stronger.
Some traders also use supply and demand zone scripts to draw these areas, though the zone you mark by hand usually teaches you more.
Liquidity Sweeps and Stop Hunts
Stops cluster in predictable places: just below swing lows, just above swing highs, and around equal highs or lows. Those clusters are liquidity. Large participants need it to fill sizeable orders, so price frequently pokes through an obvious level, triggers the stops, and then reverses. There is no need for a conspiracy theory; it is simply where the orders are.
In our example, suppose price dips to 1.0828, below the higher low at 1.0840, then closes the same 1-hour candle back at 1.0850. The wick took the stops, but the close did not confirm a break. That is a sweep, not a BOS. If it occurs inside a demand zone marked at 1.0825–1.0850, you have structure, zone and liquidity aligned.
Entry Triggers and Invalidation
A zone is a location, not a signal. Wait for price to show its hand. The reversal shapes described in the candlestick patterns guide are the usual starting point, and common triggers include:
- A rejection or engulfing candle at the zone.
- A sweep of a nearby low or high followed by a close back inside.
- A lower-timeframe break of structure in your intended direction.
- A retest of a broken level that holds.
Continuing the example: you buy at 1.0850 after the sweep candle closes, with the stop at 1.0820, below the sweep low. Risk is 30 pips. The first target is the prior high at 1.0920, 70 pips away, a reward-to-risk of about 2.3:1. The risk-reward calculator will confirm the ratio for any set of levels.
Invalidation is the price at which your idea is wrong — here, a close below the zone. Decide it before you enter, place the stop beyond it, and do not move it further away. If the invalidation point is so distant that the reward no longer justifies the risk, skip the trade.
Price action is a framework for reading probabilities, not a way of knowing what happens next. Forex and CFDs carry a high risk of loss; only risk what you can afford to lose.
FAQ
Can I trade price action without any indicators at all?
Yes. Structure, zones and candle behaviour are enough to define bias, entry and invalidation. Many price action traders still keep one or two neutral tools, such as ATR for stop sizing or a single moving average for trend context, because these support decisions rather than generate signals.
What is the difference between a break of structure and a liquidity sweep?
A break of structure is a candle close beyond the swing point that defines the trend, showing that one side has lost control. A liquidity sweep is a wick through the level that triggers stops and then closes back inside, which often precedes a move in the opposite direction.
Which timeframe is best for price action trading?
The concepts work on any timeframe, but higher timeframes usually show cleaner structure and clearer zones because they contain less noise. A common approach is to mark structure and zones on the 4-hour or daily chart, then use the 15-minute or 1-hour chart for entry triggers.
Free Candlestick Patterns Scripts for TradingView
Open-source Pine scripts from the ForexR library that build on this indicator. Copy one into TradingView's Pine Editor to try it on your own chart.
Free Candlestick Pattern Pine Scripts · How to add a script to TradingView
See these strategies traded live
ForexR Signals publishes each trade before the entry, with its stop and three targets, and tracks it against live prices. Every win and loss stays on the record. Practice trades with no real money, not advice.