Gold Price History: 1971 to 2020 in Cycles, Not Straight Lines

What Does Gold Price History Look Like as Cycles?
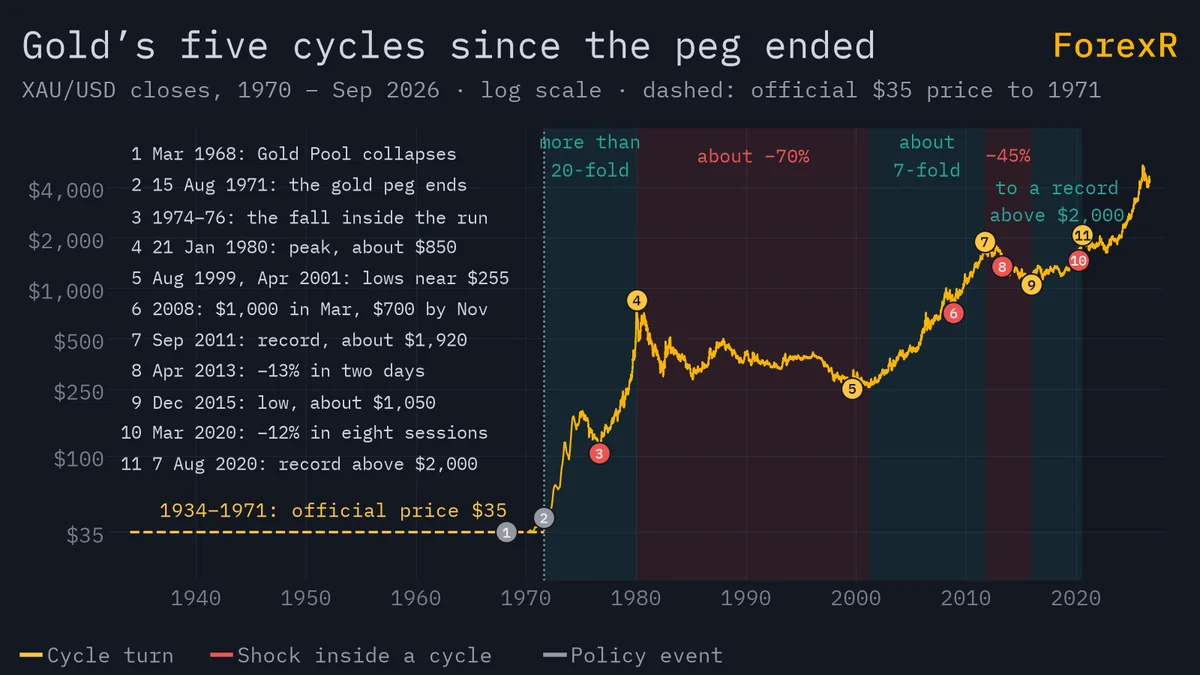
Since 1971 gold has made three great climbs and two long falls. It rose more than 20-fold in the 1970s, lost about 70% over the next 20 years, rose about 7-fold from 2001 to 2011, fell about 45% by 2015, then set a record above $2,000 in August 2020. Every turn had a cause you can name.
Why gold has value tells the 1971 story in one paragraph; this guide owns the detail of each cycle, its cause, and what a trader should keep from it.
The $35 Era and the London Gold Pool (1934-1971)
From 1934 the United States set gold at $35 an ounce, and in 1944 Bretton Woods tied the major currencies to the dollar and the dollar to that $35. For nearly four decades the price was a policy, not a market. Think of a rent freeze: the landlord keeps the old number on the contract while wages, food and everything else climb, and the longer it lasts, the bigger the jump when it ends.
By the 1960s the freeze was leaking. In 1961 a group of central banks formed the London Gold Pool, agreeing to sell gold in London whenever the free price pushed above $35. Defending the peg meant handing out reserves, and in March 1968 the pool collapsed. A two-tier market followed: an official $35 between governments and a free-market price above it.
On 15 August 1971 President Richard Nixon closed the gold window, ending the dollar's convertibility into gold. Gold has floated since.
The 1970s Run to $850 and the Fall Inside It
From $35 in 1971 gold rose more than 20-fold to a peak of about $850 on 21 January 1980. The drivers were a decade of high inflation, negative real yields, the Iranian revolution and the Soviet invasion of Afghanistan.
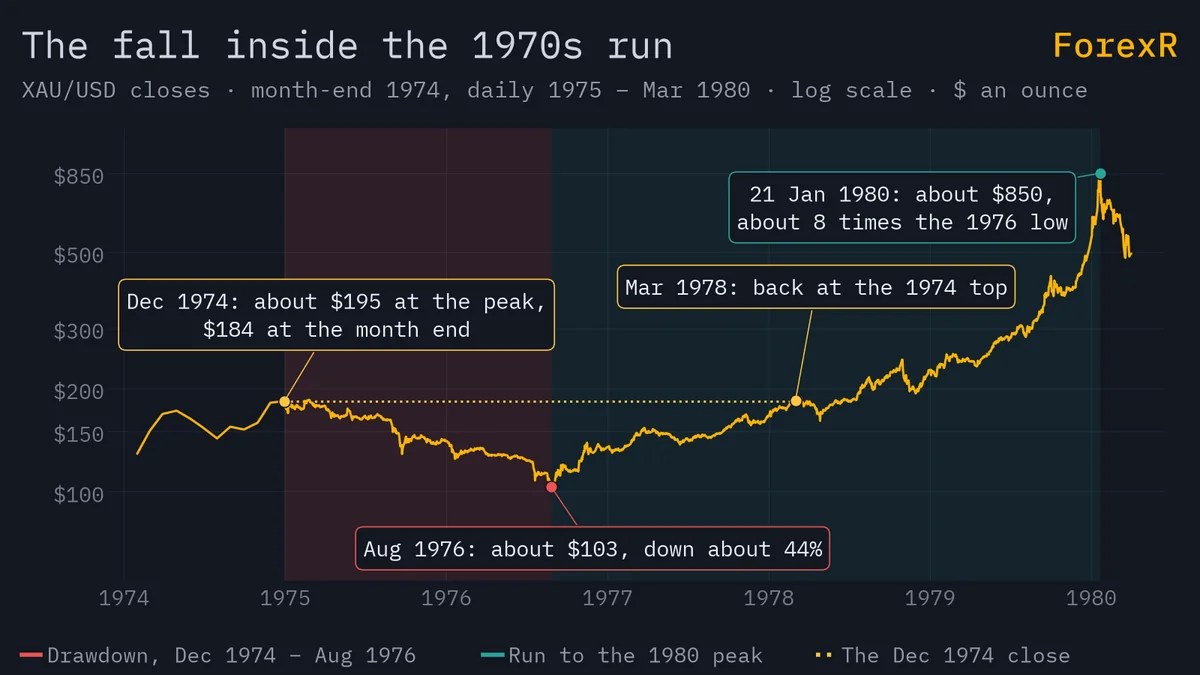
What people get wrong is the shape: the 1970s were not one clean line. Gold reached about $195 in December 1974, then fell to about $103 by August 1976, a fall of close to half, before the final run to $850. Anyone who bought the 1974 top sat through a drawdown that would have stopped out most leveraged traders. The inflation-hedge guide covers why the decade worked for gold.
The 20-Year Bear Market: 1980 to 2001
Three forces drove the 20-year decline that followed. Real yields turned high and positive once the Fed raised rates to break inflation, so holding a metal that pays nothing became expensive. Central banks became net sellers for about two decades. Miners sold future output forward to lock in prices (producer hedging), which put supply on the market before it was dug up.
Gold bottomed at about $250-255 in July and August 1999 and again at about $255 in April 2001. Between the 1980 peak and the 1999 low it lost about 70% in dollar terms while US consumer prices roughly doubled, so its purchasing power fell by more than 80%. The Bank of England sold about 395 tonnes between 1999 and 2002 at an average near $275, a decision later nicknamed Brown's Bottom after Chancellor Gordon Brown. In September 1999 the Washington Agreement on Gold capped European central bank sales at 400 tonnes a year. Central bank gold buying follows what the official sector did next.
Pin this fact above your desk: the 1980 peak of about $850 was not beaten in nominal dollars until 2008, 28 years later. In purchasing power it took far longer. "Gold always comes back" is true only if your holding period is measured in decades.
2001 to 2011: ETFs, the 2008 Dash for Cash and a Record
The next cycle started quietly from the 2001 low. Real yields fell, the dollar weakened for most of the decade and, in 2004, the first large US-listed gold ETF launched, so gold could be bought in a brokerage account. Gold and the dollar explains the pricing effect that did part of the lifting.
This cycle had a shock inside it. Gold touched about $1,000 in March 2008, then fell to about $700 in October and November 2008, about 30% down, as funds sold whatever they could to raise cash. Gold is sold in a liquidity crunch before it is bought as a haven. Once central banks flooded the system with liquidity, gold recovered first and ran to a record of about $1,920 in September 2011.
2011 to 2015: The 45% Fall Nobody Forecast
On 12 to 15 April 2013 gold dropped about 13% in two trading days, the largest two-day drop in about 30 years. It ended 2013 down about 28%, its worst year in decades, while many bank forecasts had called for higher prices. The low came in December 2015 at about $1,050, about 45% below the peak. Rising real yields, a stronger dollar and heavy selling out of gold ETFs did the damage. The forecast guide uses 2013 as its case study in how targets miss.
2015 to 2020: March 2020 and the August Record
Recovery from the 2015 low was gradual until the Covid crash. Between 9 and 19 March 2020 gold fell about 12% in about eight trading days as investors raised cash. Then rate cuts, negative real yields and liquidity carried it to a record above $2,000 in August 2020, about $2,070 on 7 August. Gold went on to set new records in later years. The safe-haven guide explains the fall-then-rally pattern.
A swing trader in Cebu who started after the 2020 record has only traded a market that mostly climbed. She keeps a printout of the April 2013 daily chart next to her screen, not as a prediction but as a reminder that a 13% two-day drop is inside gold's range and her stops must assume it.
What Repeats in Every Cycle
Three things appear in every turn.
- Real yields: negative in the 1970s, high and positive through the 1980s and 1990s, falling from 2001 to 2011, rising in 2013, negative again in 2020. Gold and interest rates walks through the mechanism.
- The dollar: a weak-dollar decade (the 2000s) lifted gold; a strong-dollar stretch (2013-2015) sank it. Both can rise together in a panic, so this is a tendency, not a law.
- Official-sector behaviour: central banks defended $35 in the 1960s, sold through the bear and near its bottom, then turned net buyers from 2010. They tend to act late, so their behaviour marks the regime rather than the timing.
Translate the cycles into dollars with a worked example at $3,000 an ounce, an example price and not a forecast. A 2013-style two-day fall of 13% is $390 per ounce: $390 on a 0.01 lot and $3,900 on a 0.10 lot. A March 2020-style 12% fall is $360 per ounce. A 2011-2015-style 45% fall takes the price to $1,650. A 1980-1999-style 70% fall takes it to $900. Redo the sums with your own lot size and ask whether your account survives each one, because each one happened.
What a Trader Should Take From History
Nothing in the record says what gold does next month. It does say four things. Gold spends years going nowhere and then moves a long way in months, so a strategy that needs a trend every week bleeds in the quiet stretches. Gold is sold first in a liquidity crunch, so a "haven" long needs room. The big turns came when real yields and the dollar changed direction together, so check those two on the live gold page before any thesis. And forecasts missed the biggest turns, so size for being wrong.
Try this in five minutes. Write six dates on paper: August 1971, January 1980, August 1999, September 2011, December 2015, August 2020. Next to each, note the direction of real yields and the dollar, using this guide. Then open the live chart on its longest timeframe and find the April 2013 candle. Pick a broker for the quiet years too: a position held through a two-year range pays swap every night, so compare long swap on the broker comparison page.
Leveraged gold CFDs carry a high risk of loss. Gold has fallen 13% in two days and 45% over four years, and it can do so again without warning. Only risk money you can afford to lose, and size every position as if the next candle is a 2013 candle.
FAQ
Why did gold fall for 20 years after 1980?
Three forces worked against it at once. Real yields turned high and positive once the Fed broke inflation, so bonds paid well while gold paid nothing. Central banks became net sellers for about two decades. Miners sold future output forward, adding supply early. Gold lost about 70% in dollar terms from the 1980 peak to the 1999 low while US consumer prices doubled.
Why did gold drop in 2008 if it is a safe haven?
Because in a liquidity crunch funds sell what they can, not what they want to. Gold touched about $1,000 in March 2008 and fell to about $700 by October and November, about 30% down, as investors raised cash to meet margin calls. Once central banks added liquidity, gold recovered before most assets and set new records from 2009 to 2011.
What is Brown's Bottom in gold?
It is the nickname for the Bank of England's sale of about 395 tonnes of gold between 1999 and 2002 at an average price near $275, announced while Gordon Brown was Chancellor. The sales came close to the 20-year low of about $250-255 in mid-1999, which is why the name stuck. The episode is often cited as evidence that official sellers tend to act late in a cycle.
Does gold price history repeat itself?
The dates and headlines never repeat, but the drivers do. Every major turn since 1971 lined up with a change in real yields, the dollar or official-sector behaviour, and every liquidity crash sold gold first. History cannot tell you the next month's direction. It can tell you how large gold's falls have been, which is what stops and position sizes should be built around.