Bitcoin (BTC/USD) Technical Analysis: Rebound Capped by R1
 Marcus ReedTechnical Analysis Lead · ForexR analyst
BTC/USD is edging higher on the day but stays capped by R1 at $65,374.43 and below its daily, H4 and 200-day trend lines ahead of today's FOMC Minutes.

| Resistance | Level | Support | Level |
|---|---|---|---|
| R3 | 67,596.79 | S1 | 63,152.07 |
| R2 | 66,532.62 | S2 | 62,087.90 |
| R1 | 65,374.43 | S3 | 60,929.71 |
| Previous day high | 65,468.44 | Previous day low | 63,246.08 |
| 20-day high | 81,876.74 | 20-day low | 61,966.77 |
| Daily pivot 64,310.26. Data as of 2026-11-18 06:32 UTC; price from a live feed, levels computed from the previous completed daily bar. | |||
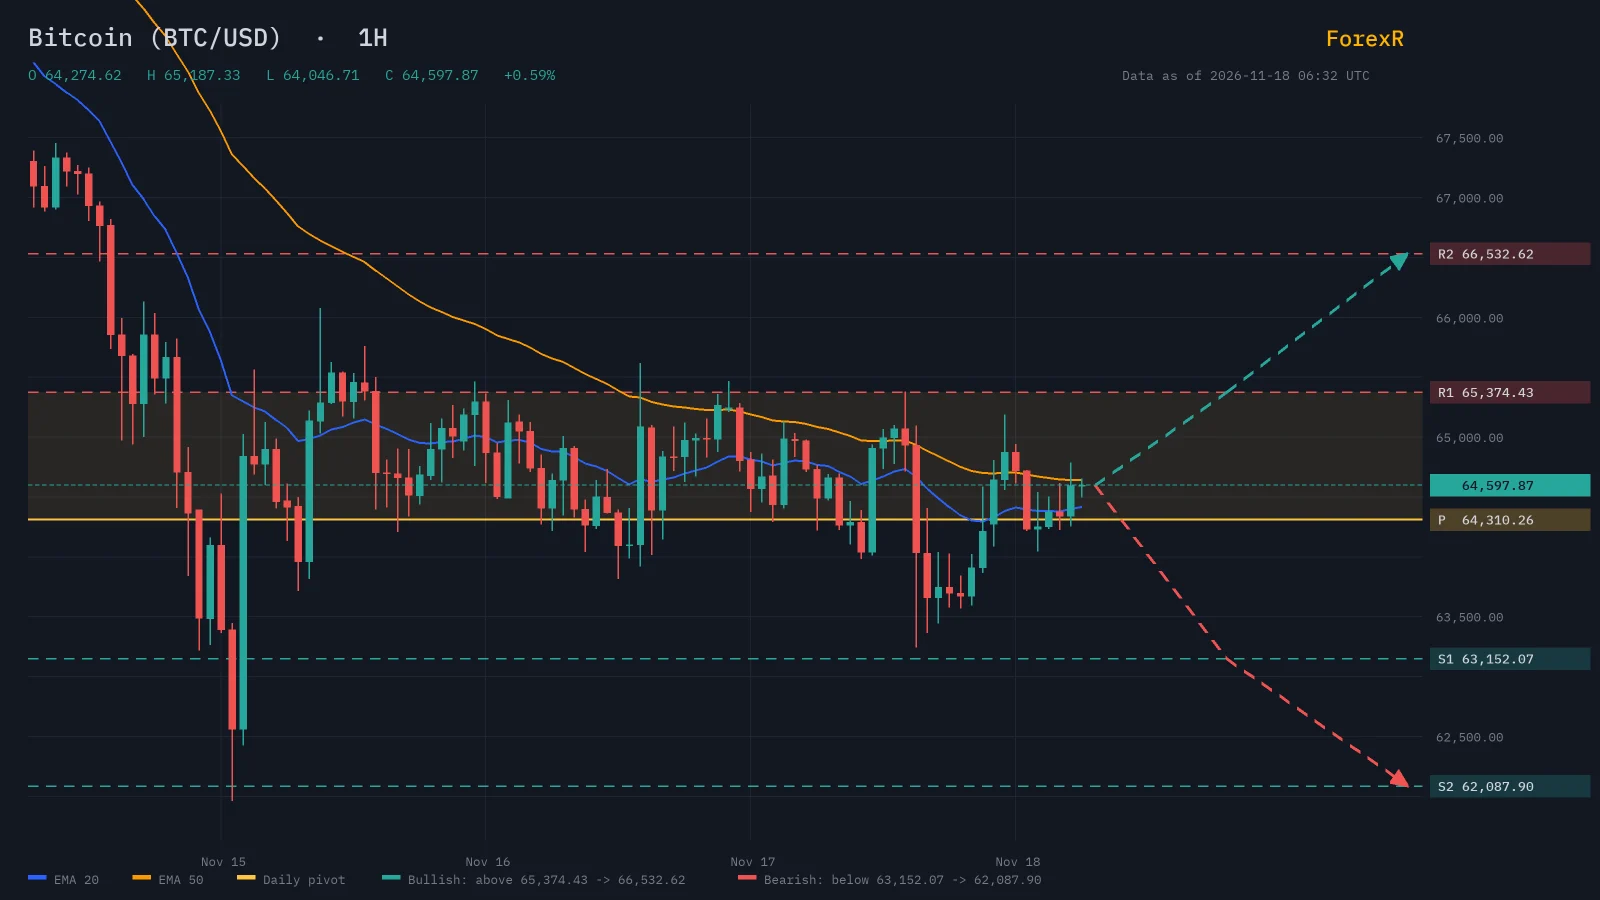
Where Bitcoin Stands Now
Bitcoin is trading at $64,597.87 in the Asia session, up $381.62, or 0.59%, from the previous close of $64,216.25. The bid sits at $64,597.87 against an ask of $64,613.09, a spread of $15.22.
The day's range has run from a low of $64,046.71 to a high of $65,187.33, a spread of $1,140.62. That is 43% of the 14-day Average True Range of $2,630.12, a relatively contained range so far relative to typical volatility (see our guide to the ATR indicator).
Trend and Momentum: Daily and H4 Point Down, H1 Mixed
The daily trend remains down, with price below all three key moving averages: the 20-day EMA at $72,227.09, the 50-day EMA at $76,125.24 and the 200-day EMA at $75,611.13. The daily RSI(14) reads 23.4, in oversold territory.
The four-hour chart shows the same downward lean, with price below its 20-period EMA at $65,177.96 and 50-period EMA at $67,934.87. The one-hour picture is mixed, with the 20-period EMA at $64,417.73 sitting just below the 50-period EMA at $64,641.26. Daily and H4 agree on a lower trend; only the shorter H1 window is mixed, so the broader technical picture leans lower without full agreement across every timeframe.
Over the past 5 days Bitcoin is down 9.64%, and over the past 20 days it is down 20.49%.
Levels That Matter
Price sits between the daily pivot at $64,310.26 and R1 at $65,374.43. The nearest support is the daily pivot, $287.61 below current price, while the nearest resistance is R1, $776.56 away (the pivot point calculator breaks down how these levels are derived).
Beyond R1, the next pivot resistances are R2 at $66,532.62 and R3 at $67,596.79. Below the daily pivot, support levels are S1 at $63,152.07, S2 at $62,087.90 and S3 at $60,929.71.
Yesterday's session, November 17, printed a high of $65,468.44 and a low of $63,246.08. Over the past 5 days the range runs from a high of $71,465.81 to a low of $61,966.77. Over the past 20 days the range runs from a high of $81,876.74 to a low of $61,966.77, the same figure as the 5-day low. The round number at $64,000 sits just below current price, and $65,000 sits just above it.
Bullish and Bearish Scenarios
Bullish case: A break above R1 at $65,374.43 would open the way toward R2 at $66,532.62. That reading would be invalidated by a move back below the daily pivot at $64,310.26.
Bearish case: A slide beneath S1 at $63,152.07 would open the way toward S2 at $62,087.90. A recovery back above the daily pivot at $64,310.26 would invalidate that case.
What Could Move Bitcoin Today
The US calendar is loaded with housing data and Federal Reserve commentary. Building Permits (MoM) and Housing Starts (MoM) both land at 13:30 UTC, with Building Permits estimated at 1.38 against a previous 1.4 and Housing Starts estimated at 1.27 against a previous 1.221. Pending Home Sales (MoM) follows at 15:00 UTC, estimated at -2 against a previous -7.3. Fed speakers are spread through the session: Daly at 17:15 UTC, Barr at 18:35 UTC, Williams at 19:30 UTC and Kashkari at 21:15 UTC, bracketing the high-impact FOMC Minutes release at 19:00 UTC (our guide to using an economic calendar covers how to read a day this loaded).
Overnight coverage from Tokenpost pointed to Bitcoin's break below its 200-week moving average and continuing outflows from US spot Bitcoin ETFs, while Crypto Daily reported a market maker's bearish long-term call, keeping the broader newsflow defensive.
As of the week to November 10, large futures speculators were positioned net long Bitcoin (BTC/USD), holding 54% of contracts long against 46% short. That net long position grew over the week, as speculators added to net long Bitcoin (BTC/USD), taking net contracts to 2,375 from 2,230.
News sentiment data shows coverage volume running at 125% of its 90-day average, with an opportunity read of -29, a bearish reading. That score followed a sharp swing over the past 24 hours, moving from -1, neutral, to as low as -58, before settling at its current level; this measures news tone and is not a forecast.
Bottom Line
Bitcoin has steadied modestly on the day, but it remains within a daily and four-hour downtrend, below its 200-day average, and inside a 20-day decline of 20.49%. Price is boxed between the daily pivot at $64,310.26 and R1 at $65,374.43 heading into a Fed-heavy calendar capped by the FOMC Minutes at 19:00 UTC; a decisive break of either level, rather than today's modest bounce, is what would reset the near-term picture.
FAQ
Why is Bitcoin rebounding slightly today despite recent weekly losses?
Today's move is a modest intraday bounce, up 0.59% from the previous close of $64,216.25 to $64,597.87. The pair remains down 9.64% over the past 5 days and 20.49% over the past 20 days, and still trades below its daily 200-day EMA at $75,611.13.
How could today's FOMC Minutes and Fed speeches affect BTC/USD?
The FOMC Minutes are due at 19:00 UTC, flanked by Fed speakers Daly (17:15 UTC), Barr (18:35 UTC), Williams (19:30 UTC) and Kashkari (21:15 UTC). Price currently sits $287.61 above the daily pivot at $64,310.26 and $776.56 below R1 at $65,374.43, so both levels are within range of the day's remaining volatility.
What does Bitcoin trading below its 200-day EMA signal for the trend?
The daily chart shows price below its 20-day EMA at $72,227.09, 50-day EMA at $76,125.24 and 200-day EMA at $75,611.13, with the daily trend state registering as down. The four-hour trend is also down, and the daily RSI(14) at 23.4 is in oversold territory.
Is Bitcoin's weekly futures positioning bullish or bearish among large speculators?
As of the week to November 10, CFTC data showed large speculators net long Bitcoin (BTC/USD), with 54% of contracts long versus 46% short. That net long position increased over the week, from 2,230 to 2,375 contracts, though positioning data reflects past behavior rather than a forecast.
More Bitcoin (BTC/USD) Analysis
 Bitcoin (BTC/USD) News Today: Trend Points Lower Below PivotBitcoin continues to trade below its daily moving averages during the London session, facing immediate resistance at the daily pivot ahead of a busy US economic calendar.
 Marcus Reed
 Bitcoin (BTC/USD) Forecast Today: Support Tested Near $64,186BTC/USD is down 1.37% on the day and pinned between S1 at 64185.75 and the daily pivot at 64900.98, with daily, H4 and H1 trends all pointing lower ahead of today's US Retail Sales data and a run of Fed speeches.Marcus Reed
 Bitcoin Slides Toward 4-Month Low Ahead of Retail SalesBitcoin sits between S1 at $64,185.75 and the daily pivot at $64,900.98 after a 1.14% daily decline, with US Retail Sales data due later today.Marcus Reed
 Why Is Bitcoin (BTC/USD) Moving Today: Price Tests Daily Pivot SupportBitcoin is down on the day near 64502.23 after reported weekend liquidations, holding above the daily pivot at 64351.47 with every tracked trend reading pointing lower.Marcus Reed
 Bitcoin (BTC/USD) Price Today: Downtrend Tests Pivot SupportBitcoin is down 0.73% on the day and holding just above the daily pivot at 64351.47, with trend down across daily, H4 and H1 timeframes and a run of Fed speeches, including a high-impact Fed Chair Warsh address, ahead today.Marcus ReedBitcoin Slides Below $67,500 as All Timeframes Turn BearishBitcoin has slipped to $67,310.97, down 1.51% on the day, with daily, H4 and H1 trend all pointing lower and price now sitting between S1 at $66,763.78 and the daily pivot at $69,114.80.Marcus Reed
Trade signals on Bitcoin (BTC/USD): 3 live, 0 waiting for entry → Practice trades tracked against live prices, not advice.