Ethereum (ETH/USD) Technical Analysis
 Marcus ReedTechnical Analysis Lead · ForexR analyst
Ethereum holds steady during the London session beneath the previous day high of 2448.26. Conflicting timeframes establish a neutral technical bias as markets await US labor data.

| Resistance | Level | Support | Level |
|---|---|---|---|
| R3 | 2,731.28 | S1 | 2,280.76 |
| R2 | 2,589.77 | S2 | 2,139.25 |
| R1 | 2,506.02 | S3 | 2,055.50 |
| Previous day high | 2,448.26 | Previous day low | 2,223.00 |
| 20-day high | 2,524.38 | 20-day low | 2,170.03 |
| Daily pivot 2,364.51. Data as of 2026-11-05 07:15 UTC; price from a live feed, levels computed from the previous completed daily bar. | |||
London Session: Ethereum Consolidates the Recent Advance
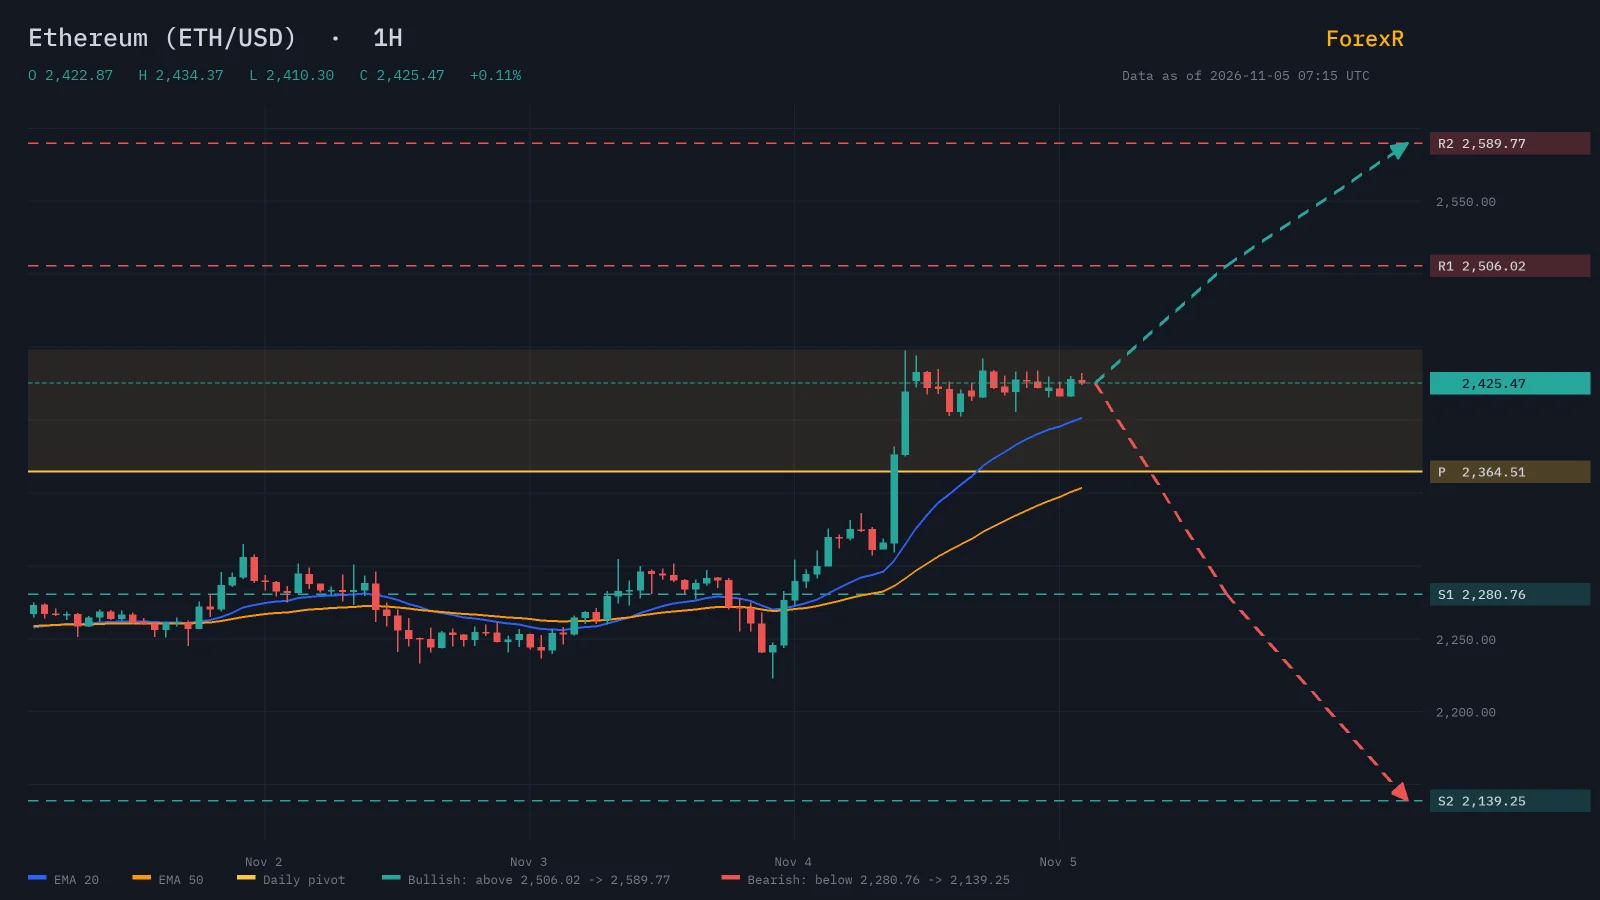
During the London session, Ethereum (ETH/USD) trades at 2425.47, moving up 0.11% on the day. Price currently sits between the daily pivot at 2364.51 and the R1 resistance level at 2506.02. The day high rests at 2434.37, established after climbing from an open of 2422.87 and a day low of 2410.30. This price action creates a narrow day range of 24.07 dollars, representing 26% of the 14-day Average True Range of 92.15 dollars.
Conflicting Signals Across Timeframes
The technical evidence presents conflicting structures across the chart horizons, setting the overall bias to neutral. The daily timeframe shows a mixed state, though the current price holds above the 200-period Exponential Moving Average at 2315.60. Further up on the daily chart, the 20-period EMA sits at 2355.03 and the 50-period EMA tracks at 2408.46, indicating compression. The 14-period daily RSI reads 54.1, reflecting a lack of extreme momentum.
In contrast to the mixed daily picture, intraday momentum points higher. The 4-hour timeframe is in an upward state, supported by a 20-period EMA at 2336.53 and a 50-period EMA at 2316.05. The 1-hour chart confirms this shorter-term strength, registering an upward state with its 20-period EMA at 2401.45 and the 50-period EMA at 2353.55.
Immediate Support and Resistance Mapping
The nearest overhead resistance is the previous day high at 2448.26, standing 22.79 dollars away from current action. On the downside, the nearest support is the daily pivot at 2364.51, located 60.96 dollars away. Institutional order flow often clusters near round numbers, with levels noted at 2450 above and 2400 below.
Looking at the standard pivot points, resistance beyond the immediate ceiling scales up to R1 at 2506.02, R2 at 2589.77, and R3 at 2731.28. Support beneath the daily pivot steps down to S1 at 2280.76, S2 at 2139.25, and S3 at 2055.50. Contextualizing recent boundaries, the 5-day window spans from a low of 2223.00 to a high of 2448.26. The wider 20-day window covers a lower bound of 2170.03 and peaks at a high of 2524.38.
Technical Breakout Scenarios
A breakout above the R1 trigger at 2506.02 would open the way to the R2 target at 2589.77. A move back below the daily pivot at 2364.51 would invalidate this bullish view.
Conversely, a decline that breaks below the S1 trigger at 2280.76 would open the way to the S2 target at 2139.25. A move back above the daily pivot at 2364.51 would invalidate the bearish path.
Market Catalysts: US Data and Media Sentiment
The macroeconomic focus shifts as New York joins at 12:00 UTC, bringing a slate of medium-impact US releases to the economic calendar today. The Challenger Job Cuts report posts at 10:30 UTC, following a previous print of 43.281. A cluster of data hits the tape at 13:30 UTC, including Unit Labor Costs with an estimate of 0.6 against a previous 1.2, Initial Jobless Claims estimated at 196 compared to the prior 194, and Nonfarm Productivity carrying an estimate of 2.5 against the previous 1.4. Federal Reserve Governor Hammack is scheduled to speak at 13:50 UTC.
In the newsflow, headlines from Crypto Briefing and Tokenpost focus on recent spot ETF inflows ending an outflow streak, while broader cryptocurrency market strength draws coverage from CoinPedia and Benzinga. The independent news sentiment opportunity reading sits at 35, which registers as bullish.
The Bottom Line
Ethereum maintains a tight intraday consolidation beneath the 2448.26 peak established during the previous session. A definitive move past this resistance tests the upper technical bounds, while the 2364.51 pivot anchors the immediate downside. The clash between a mixed daily trend and upward intraday momentum leaves directional conviction dependent on upcoming structural breaks.
FAQ
What are the critical support and resistance levels for ETH/USD today?
The nearest resistance for Ethereum sits at the previous day high of 2448.26, followed by the R1 pivot level at 2506.02. Immediate support is located at the daily pivot of 2364.51, with the round level of 2400 also positioned nearby.
How are spot ETF inflows impacting Ethereum (ETH/USD) today?
News outlets including Tokenpost and Crypto Briefing report that recent spot ETF inflows have ended a prior outflow streak, coinciding with a bullish opportunity reading of 35 from independent news sentiment data.
Could US economic data and Fed speeches affect Ethereum today?
Yes, multiple medium-impact US data points arrive today, including Challenger Job Cuts at 10:30 UTC and Initial Jobless Claims at 13:30 UTC. Fed Governor Hammack also delivers a scheduled speech at 13:50 UTC, which can introduce cross-market volatility.
More Ethereum (ETH/USD) Analysis
 Ethereum (ETH/USD) Forecast Today: Neutral Stance Amid Tight RangeEthereum marks narrow intraday gains while holding above the daily pivot. Conflicting trends across the daily and H1 charts leave the near-term bias neutral.
 Marcus Reed
 Ethereum (ETH/USD) Price Prediction Today Leans LowerETH/USD last prints at 2217.48 in the London session, down 0.79% on the day, with daily, H4 and H1 trends all down between S1 at 2146.42 and the daily pivot at 2290.46.Marcus Reed
 Ethereum Slides 7.6% as US Payrolls Data LoomEthereum has fallen 7.6% on the day, more than double its average daily range, and is holding just above the previous day low as high-impact US labor data looms.
 Oliver Hayes
 Why Is Ethereum Moving Today? Asia Tape Is MixedETH/USD is at 2426.27 in the Asia session, up 6.79% on the day and 1.9 times ATR, with a neutral bias. Nearest levels are the previous day high at 2441.7 and the daily pivot at 2363.24.Oliver Hayes
 Ethereum (ETH/USD) Technical Analysis: Testing R1 Near $2,305Ethereum holds between the daily pivot at $2,271.06 and R1 at $2,305.20, with daily, H4 and H1 trends in conflict ahead of today's US ADP and ISM Services releases.Marcus Reed
 Why Ethereum (ETH/USD) Is Testing $2,300 ResistanceEthereum is up 1.81% on the day and testing R1 resistance at $2,298.55, but the daily trend remains below its 200-day EMA while the one-hour trend points higher, leaving the setup neutral until either the daily pivot or R1 gives way.Marcus Reed
Trade signals on Ethereum (ETH/USD): 1 live, 1 waiting for entry → Practice trades tracked against live prices, not advice.